R and RStudio
R is a programming language that allows users to compute statistics and graphics. It is based on S and is a GNU Project. It has several built-in function to compute statistics with ease, as well as allowing users to build their own functions to be executed.
Installing R
R can be installed from the R-Project with these general instructions:
- Go to R’s website
- Select download R in the first paragraph
- Choose 0-Cloud to automatically choose the closes mirror.
- Select and follow the instructions for the respective operating system
RStudio
RStudio is an integrated development environment (IDE) that allows users to write code in a script and execute code to the R console in one application. Furthermore, RStudio has rich set of features that make data science projects easier to execute.
While RStudio has originally been used to program in R, it has been extended to program in python with the use of the reticulate package.
Installation
You can download and install the open-source (free) version of RStudio here.
Start-up
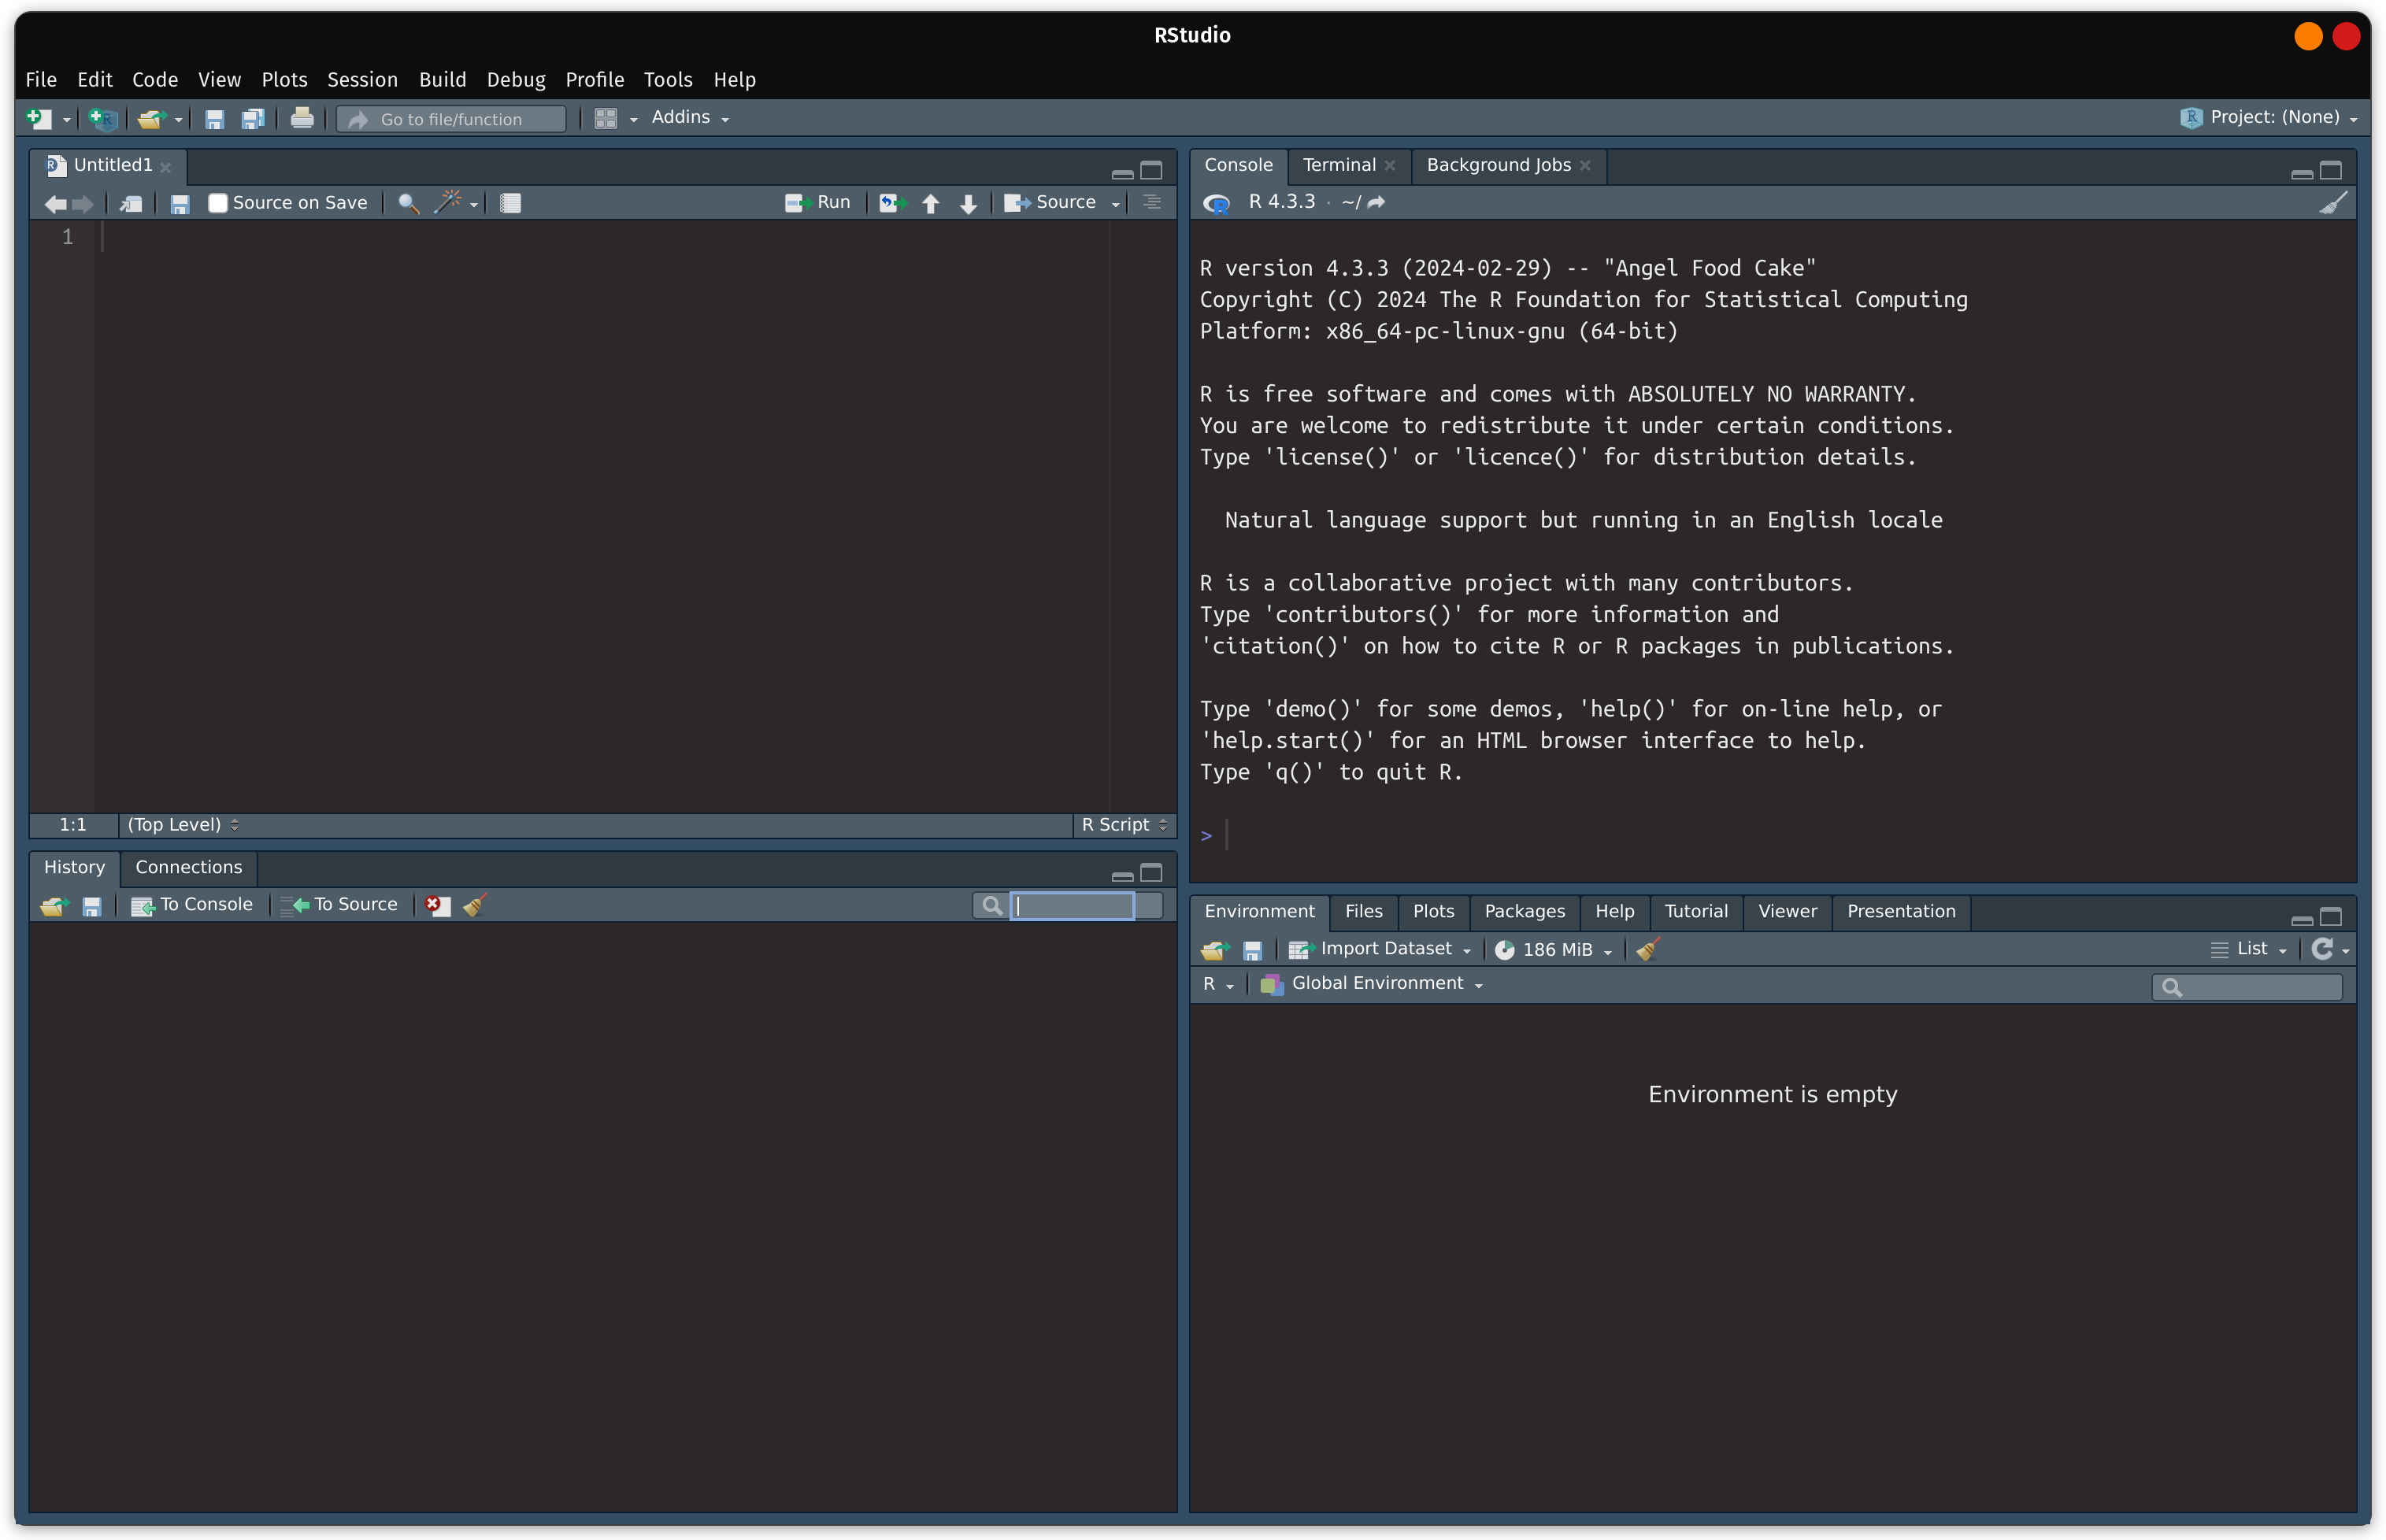
On start-up, RStudio will look like very similar to the image below:
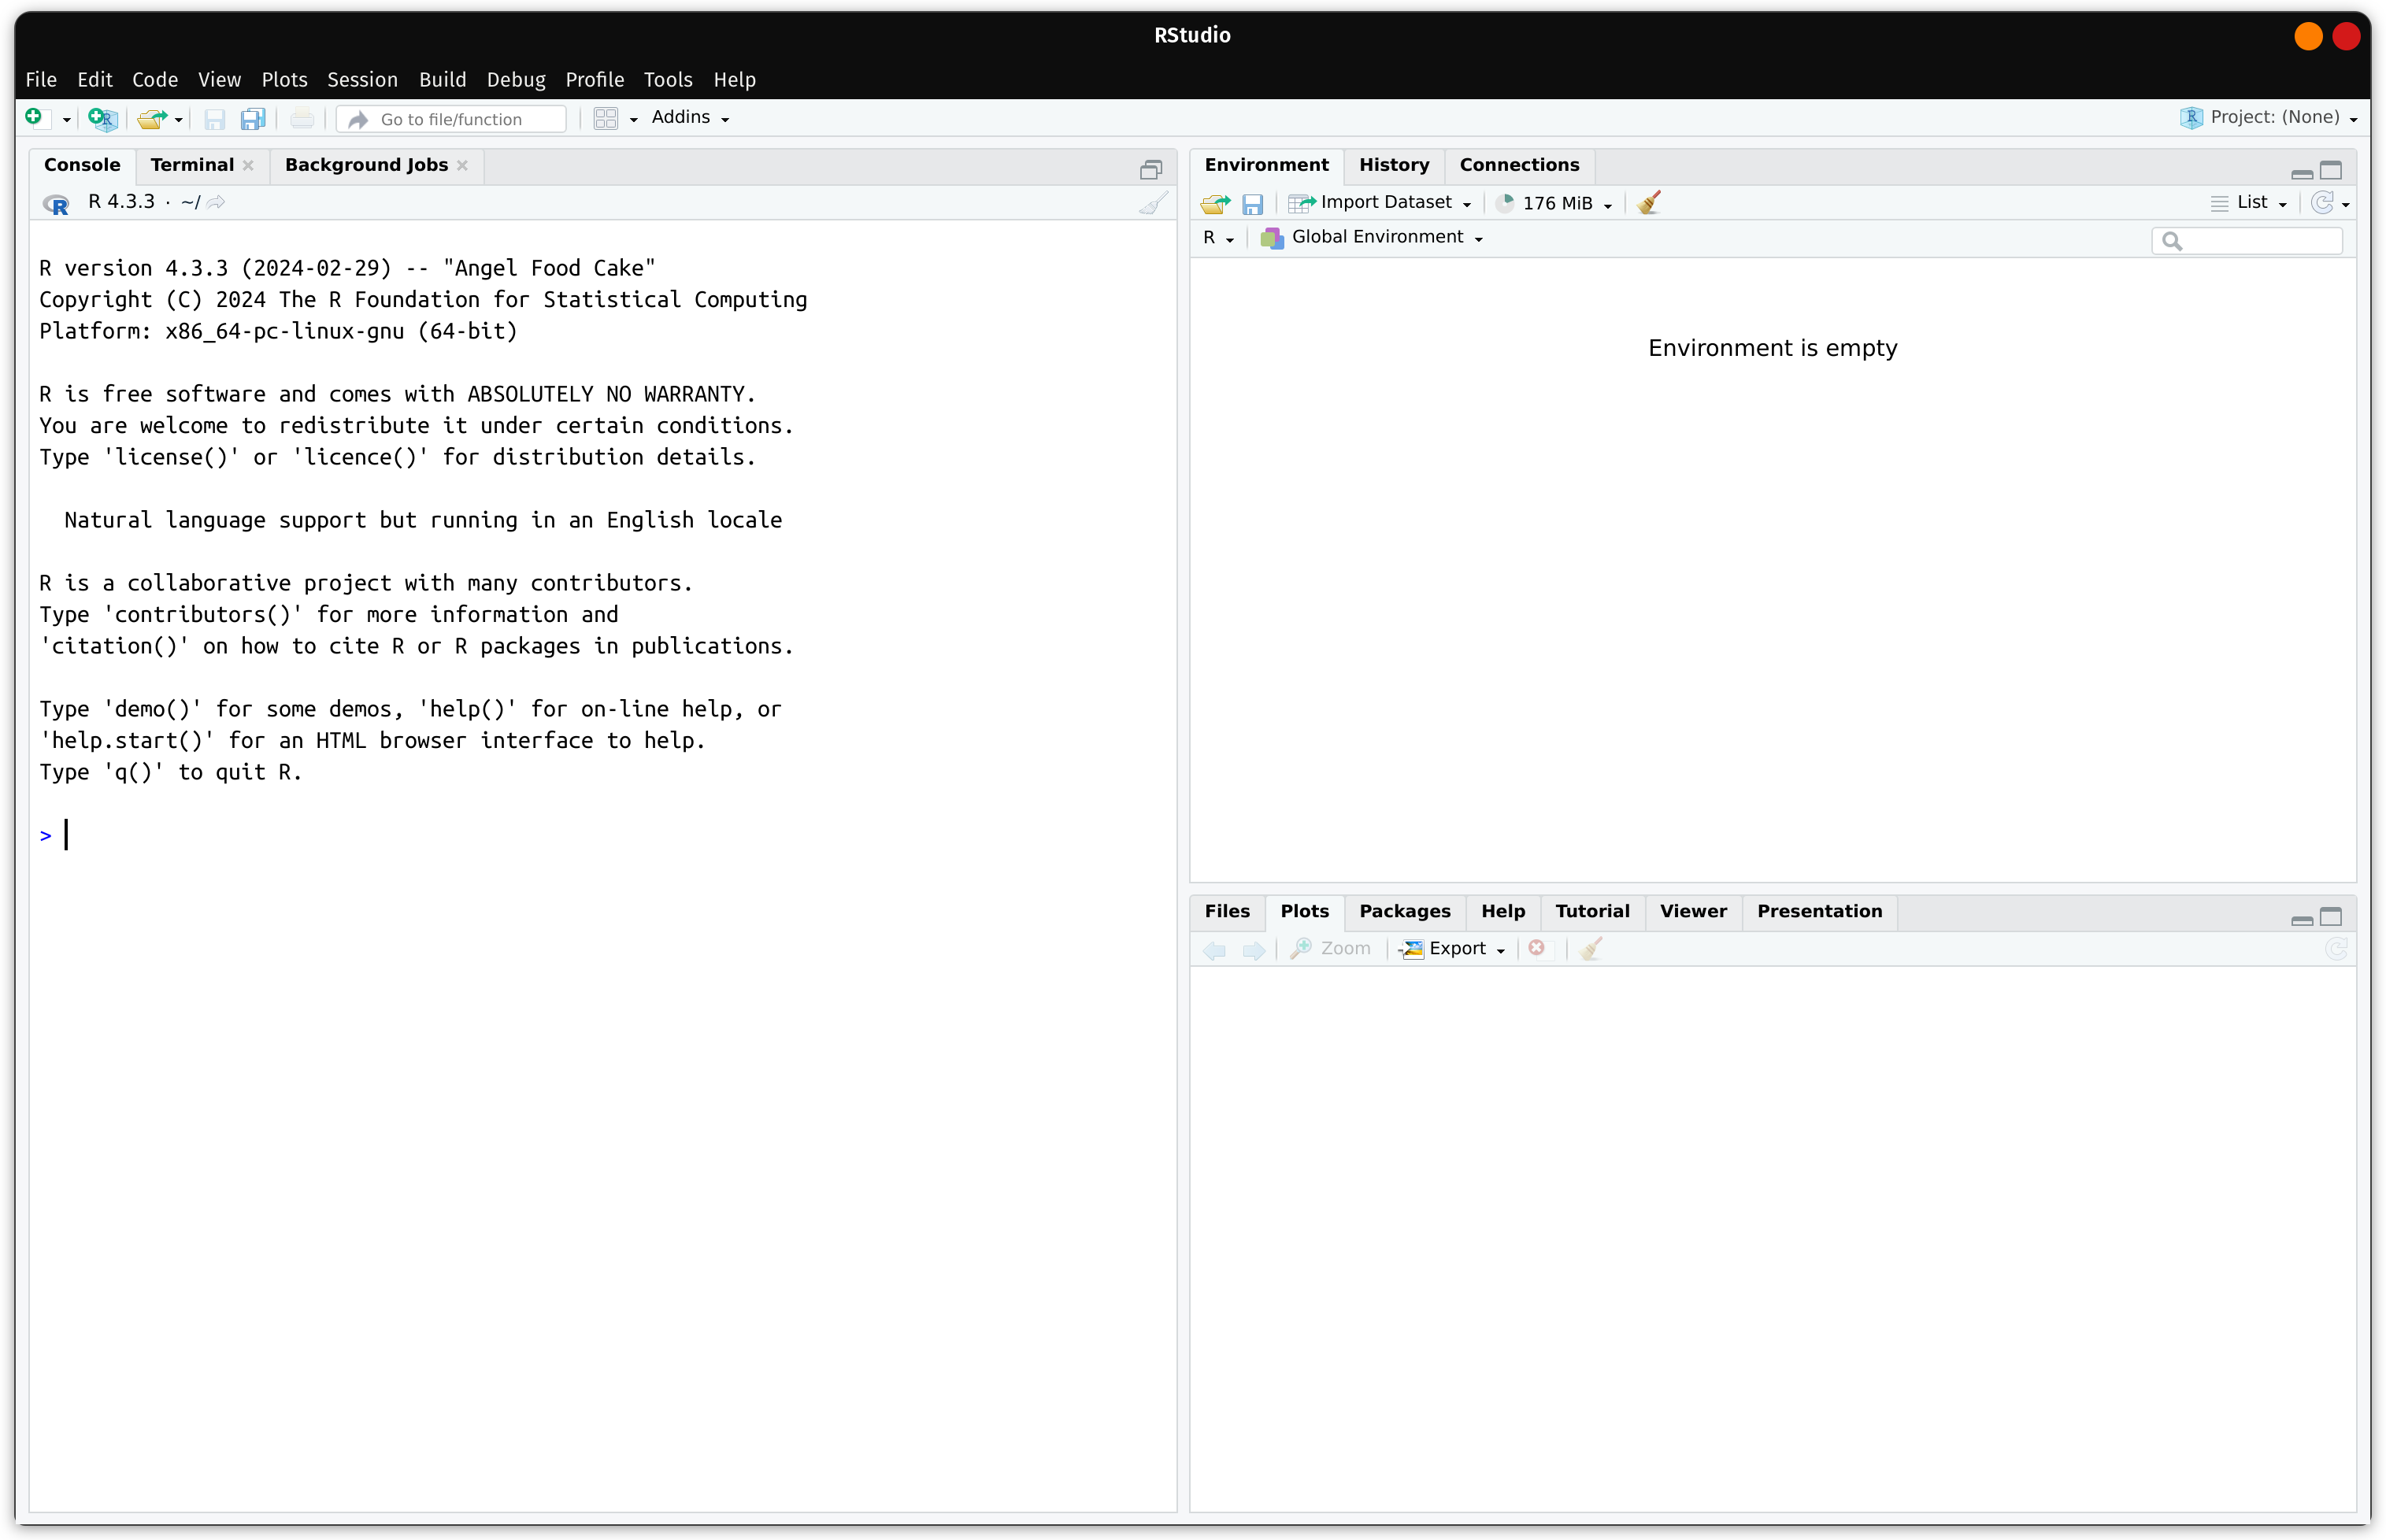
You can see that there are 3 parts in RStudio, these are known as panes.
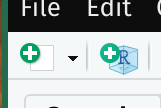
Additionally, we can add a fourth pane to RStudio for writing code in a text file. Choosing the white plus sign with a green border followed by a white document on the upper-right hand side:
This will open up a menu of text files that a user can choose to code in:
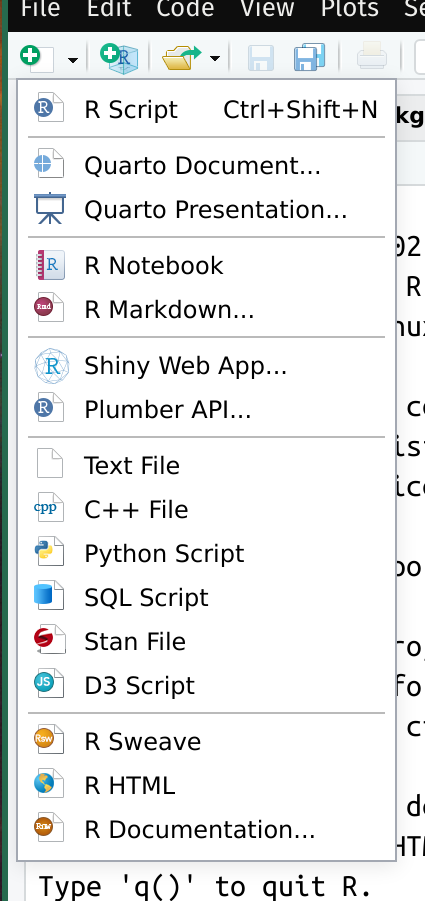
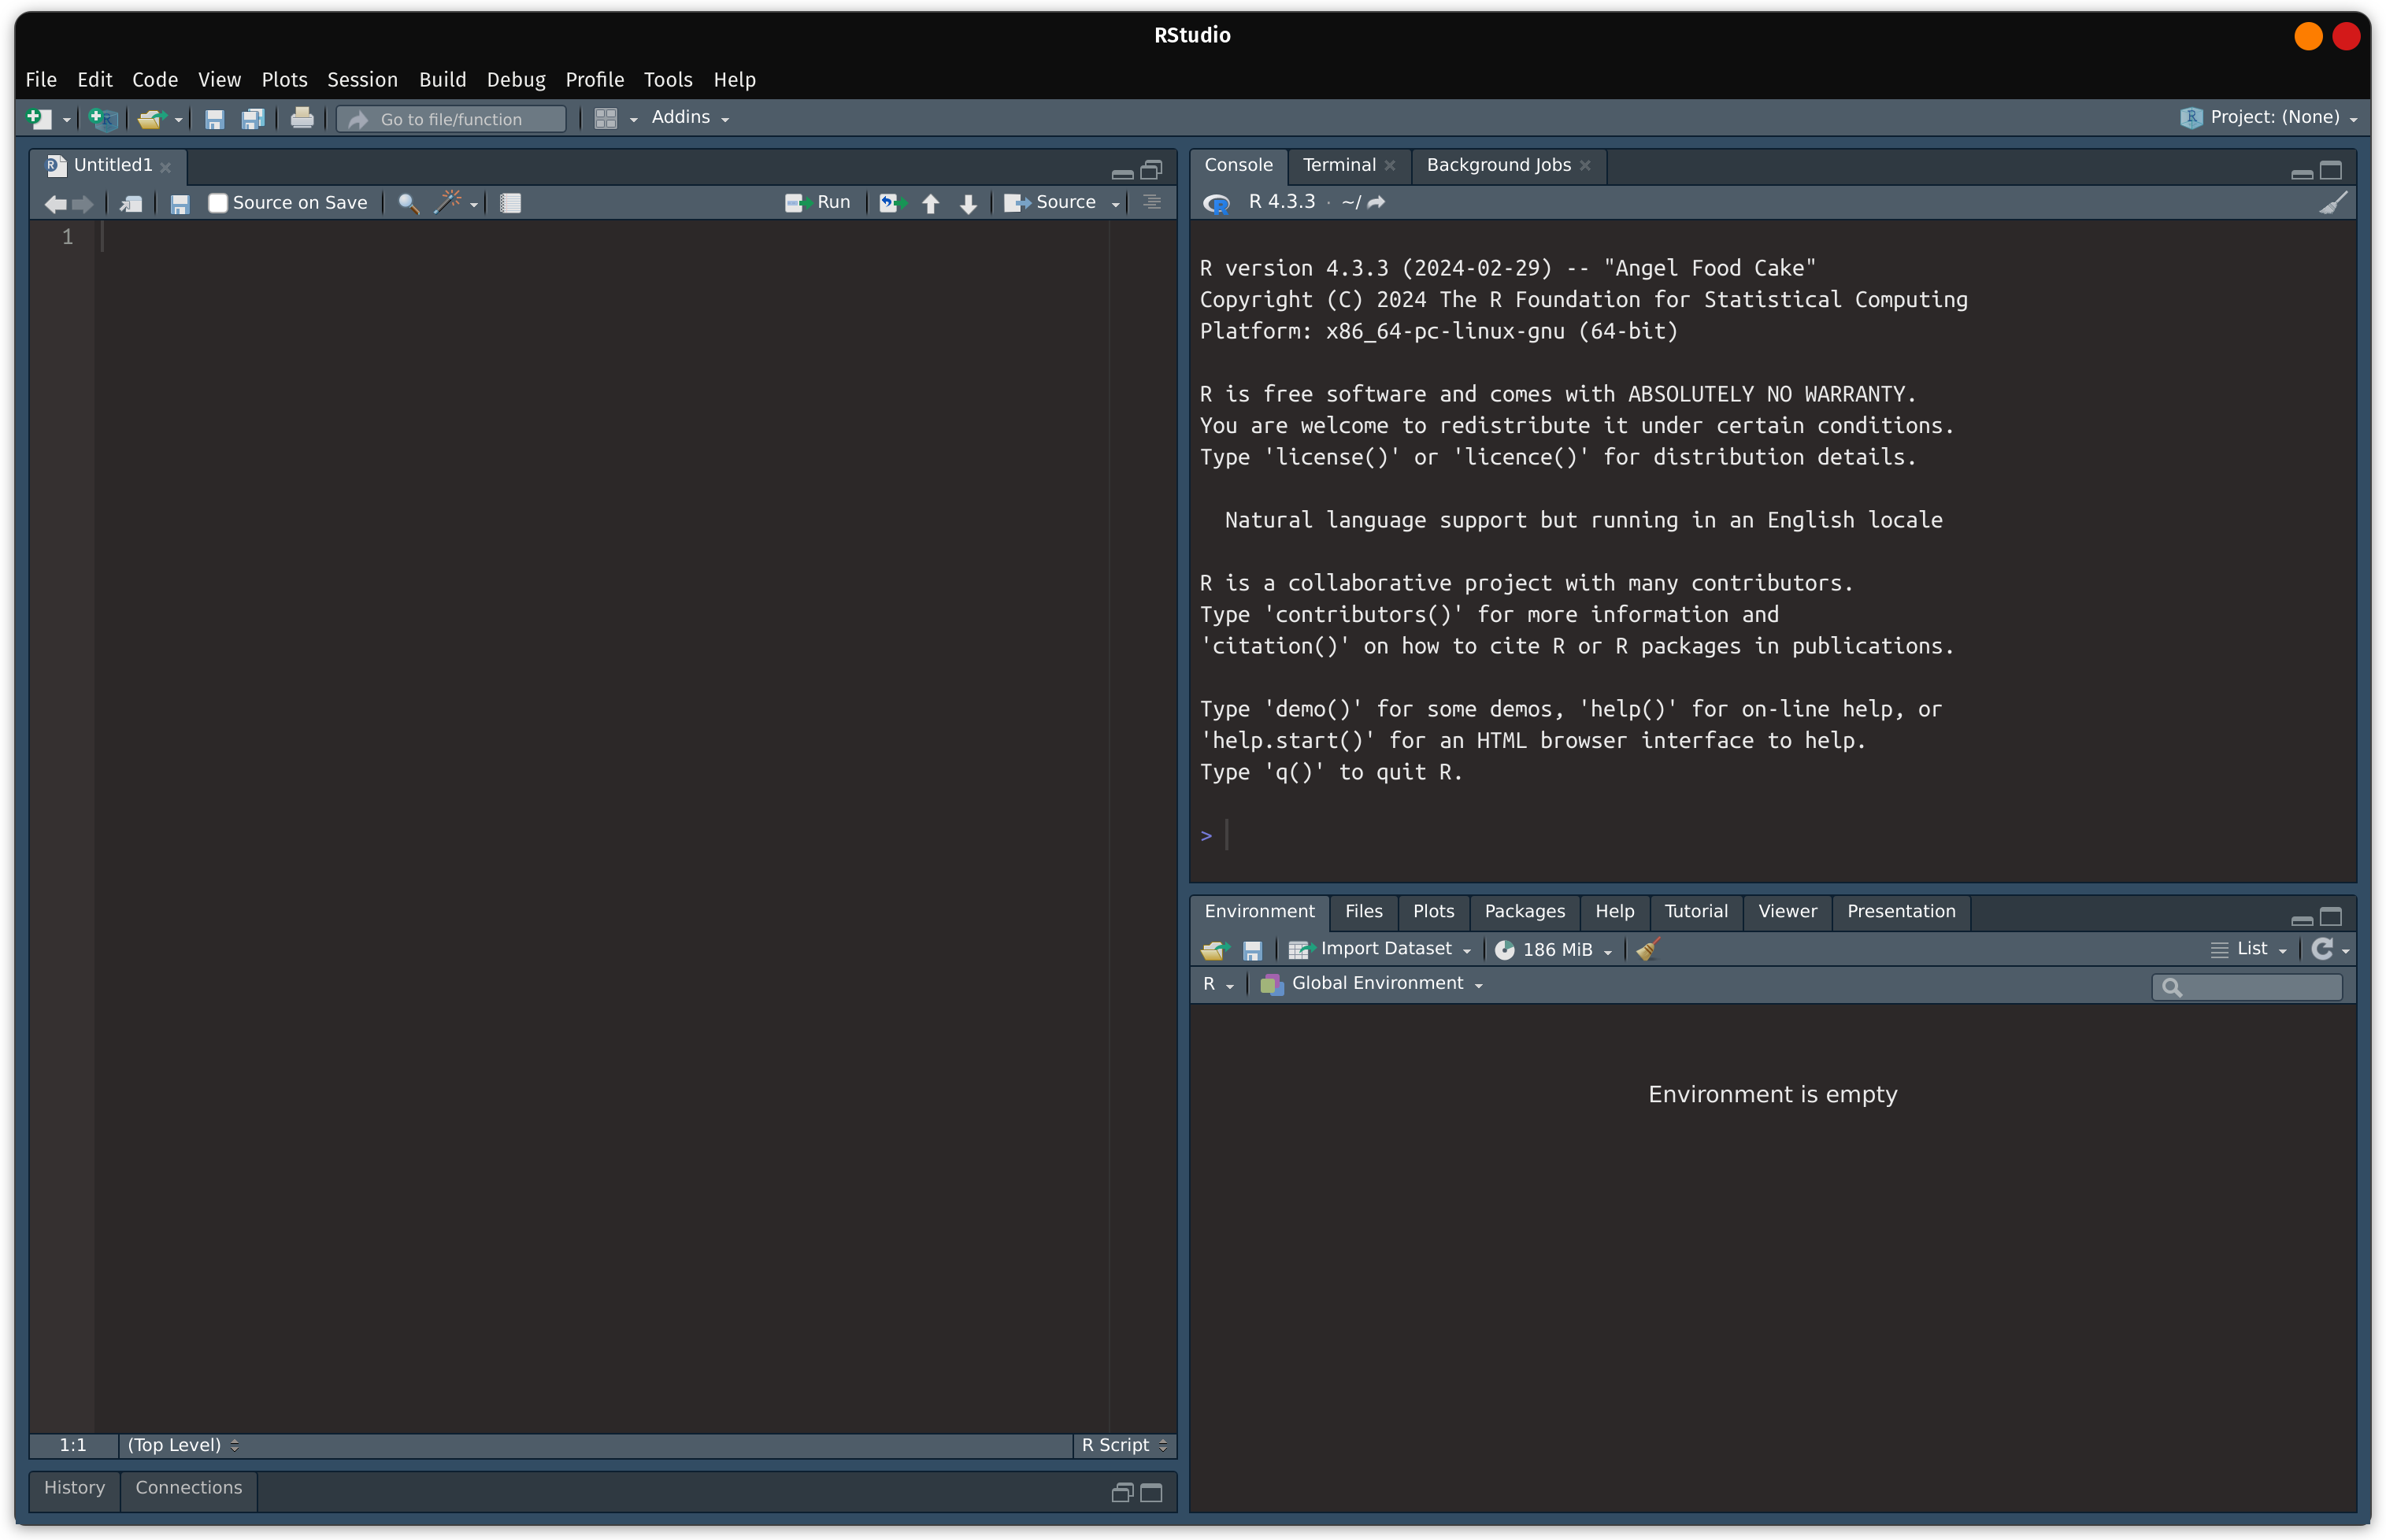
The “R Script” Button will open a standard R text file with the extension as “.R”. This is the text file that most R programmers used to save and execute code. This will make RStudio to look like this:
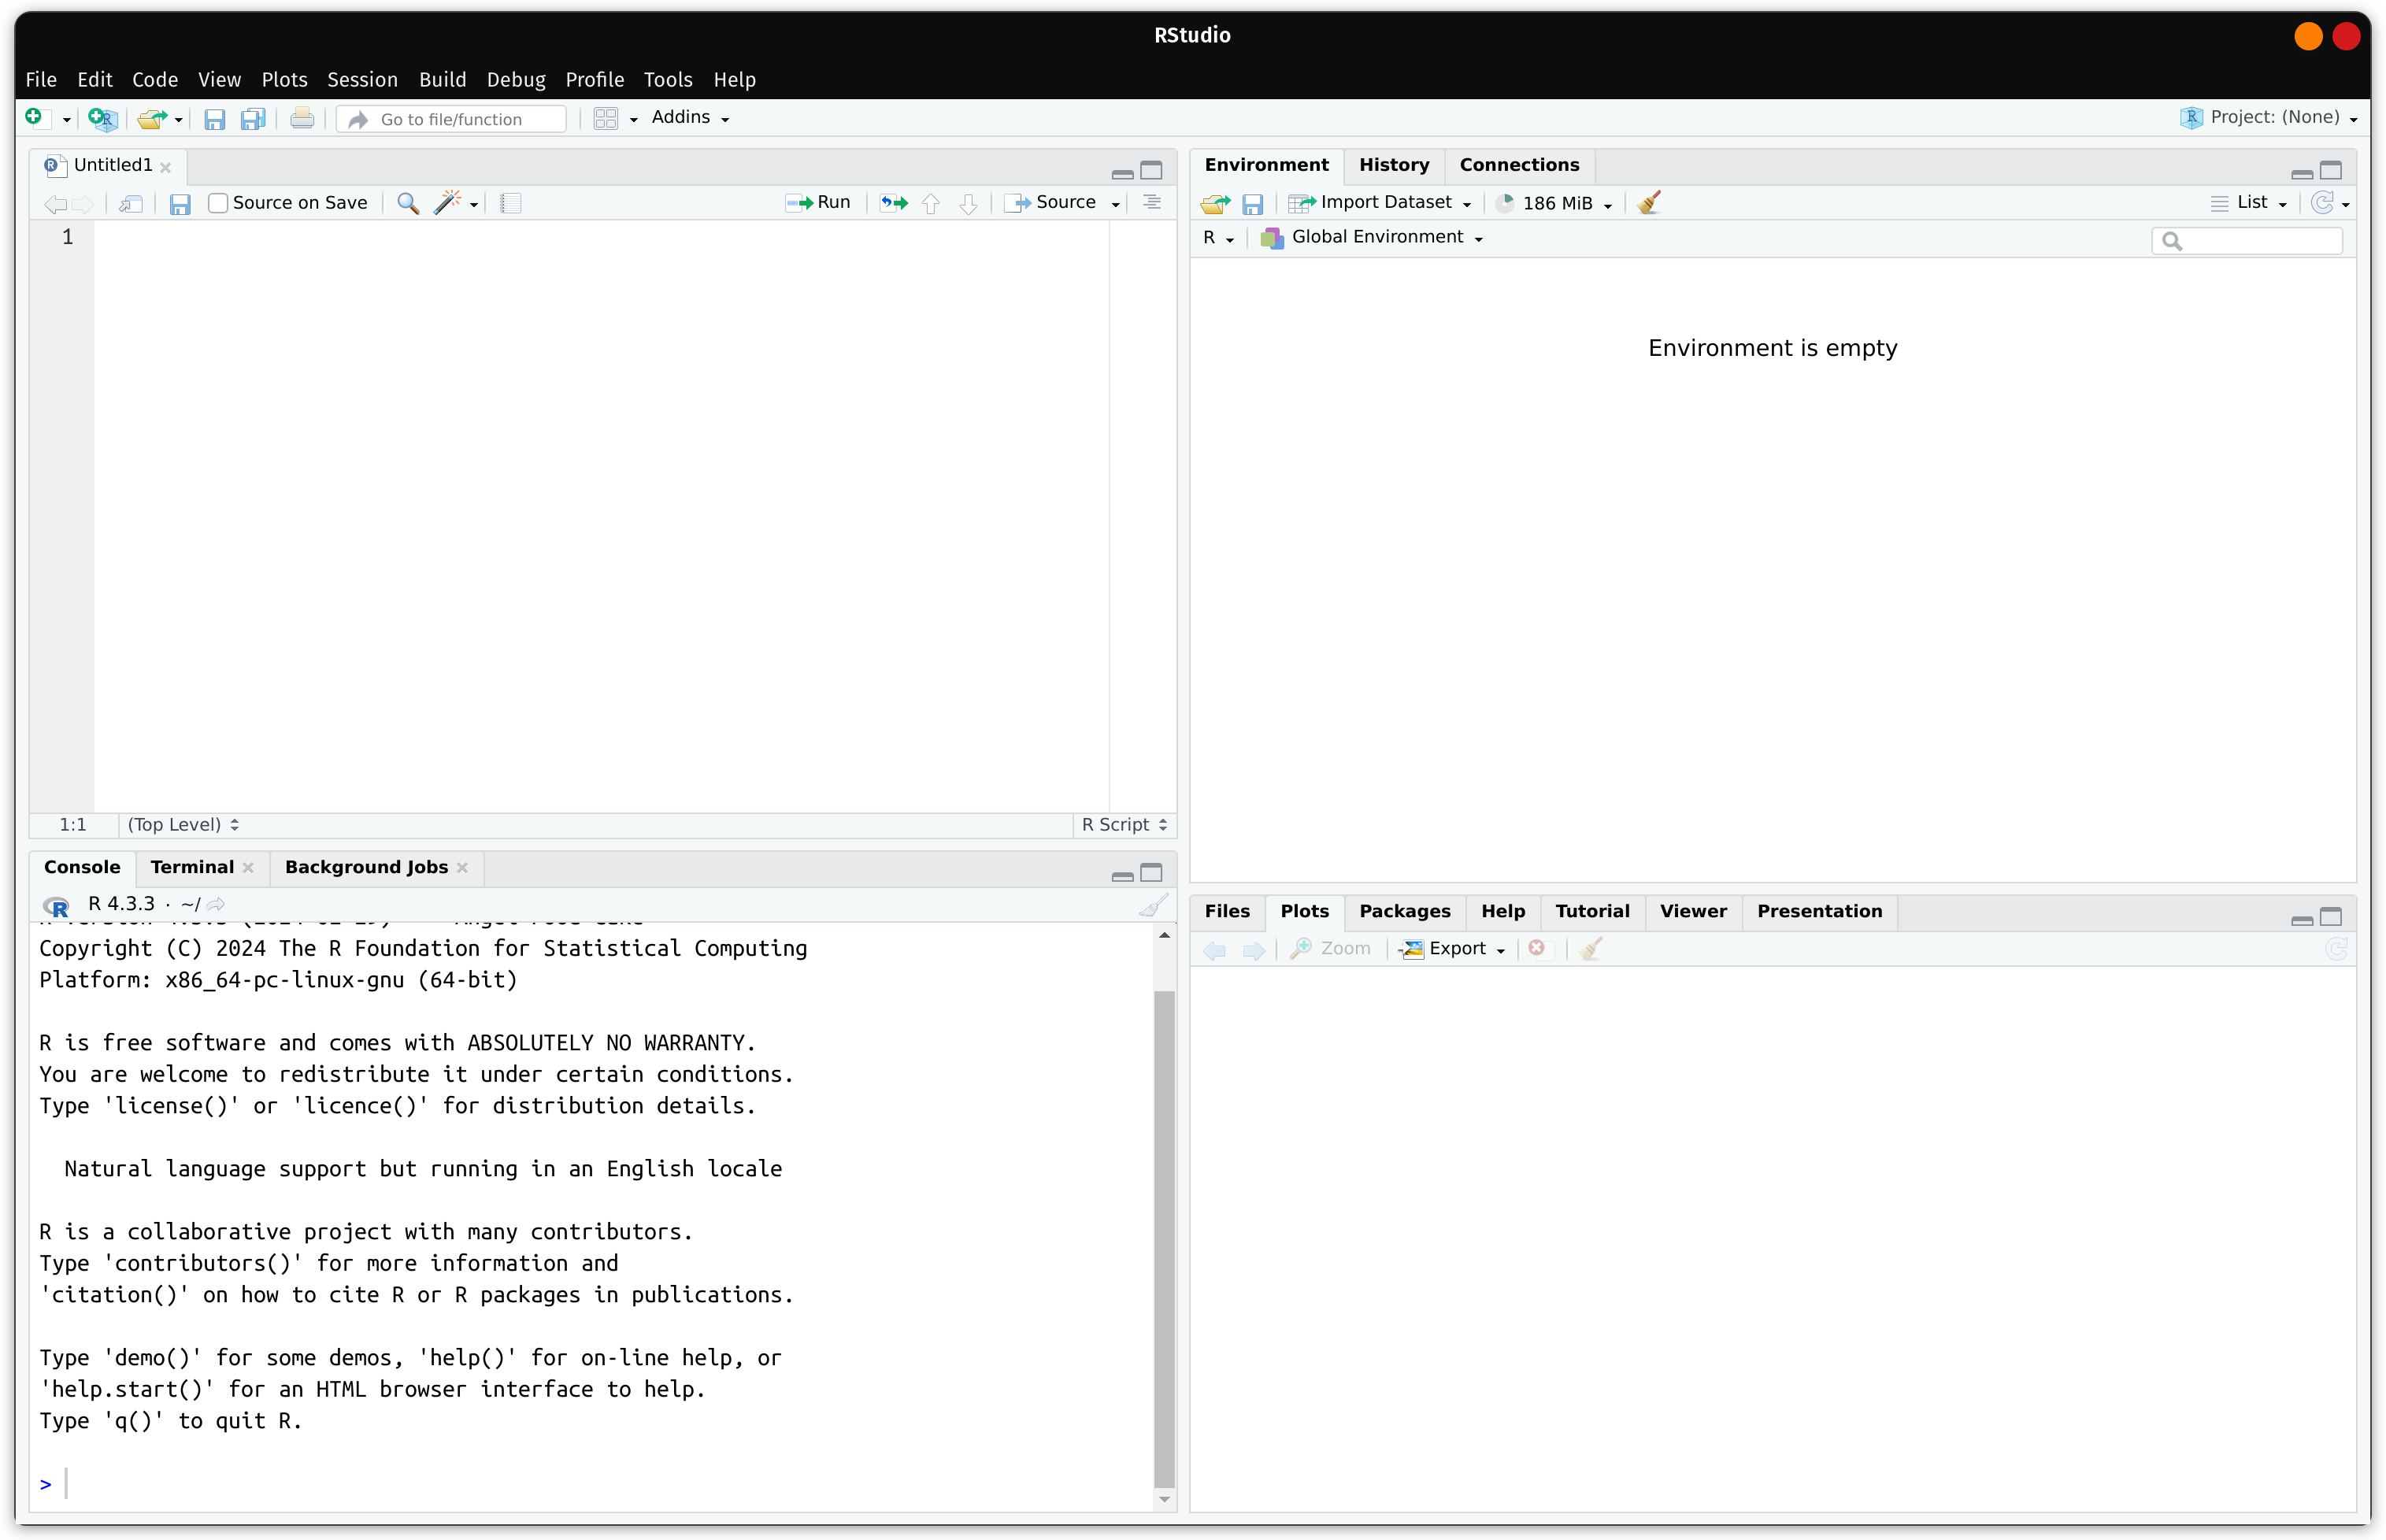
Notice a new pane is created on the top-left that allows you to write R code in a script. This script is also connected to the R console below which will allow you to send lines of code from the script to the console to be executed (also known as REPL).
Global Options
In this section, here are some recommended “Global Options” for users to set in RStudio. To begin, click on Tools ➜ Global Options from the top-menu. The following window should open:
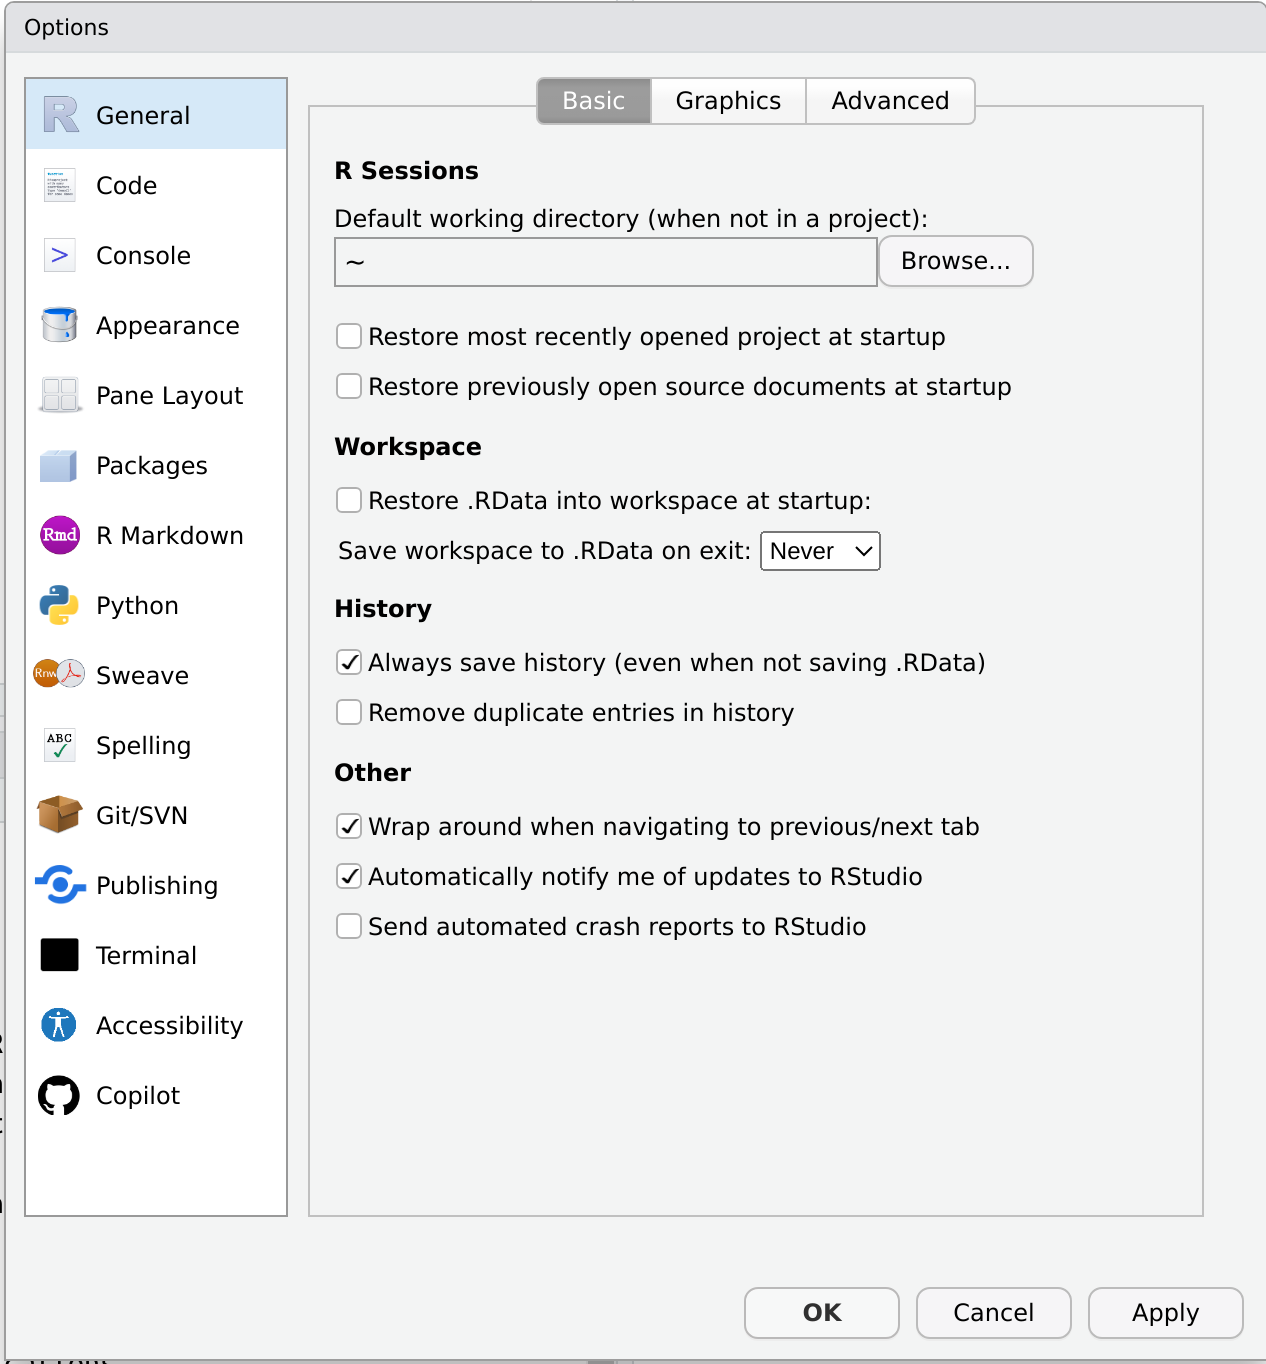
The window allows you to make several changes in RStudio that will make your experience better. Here is a list of items that are recommended for users to change:
- R General
- Make sure “Restore .RData into workspace at startup:” is unchecked (Highly Recommended1)
- Set “Save workspce to .RData on exit:” to “Never” (Highly Recommended)
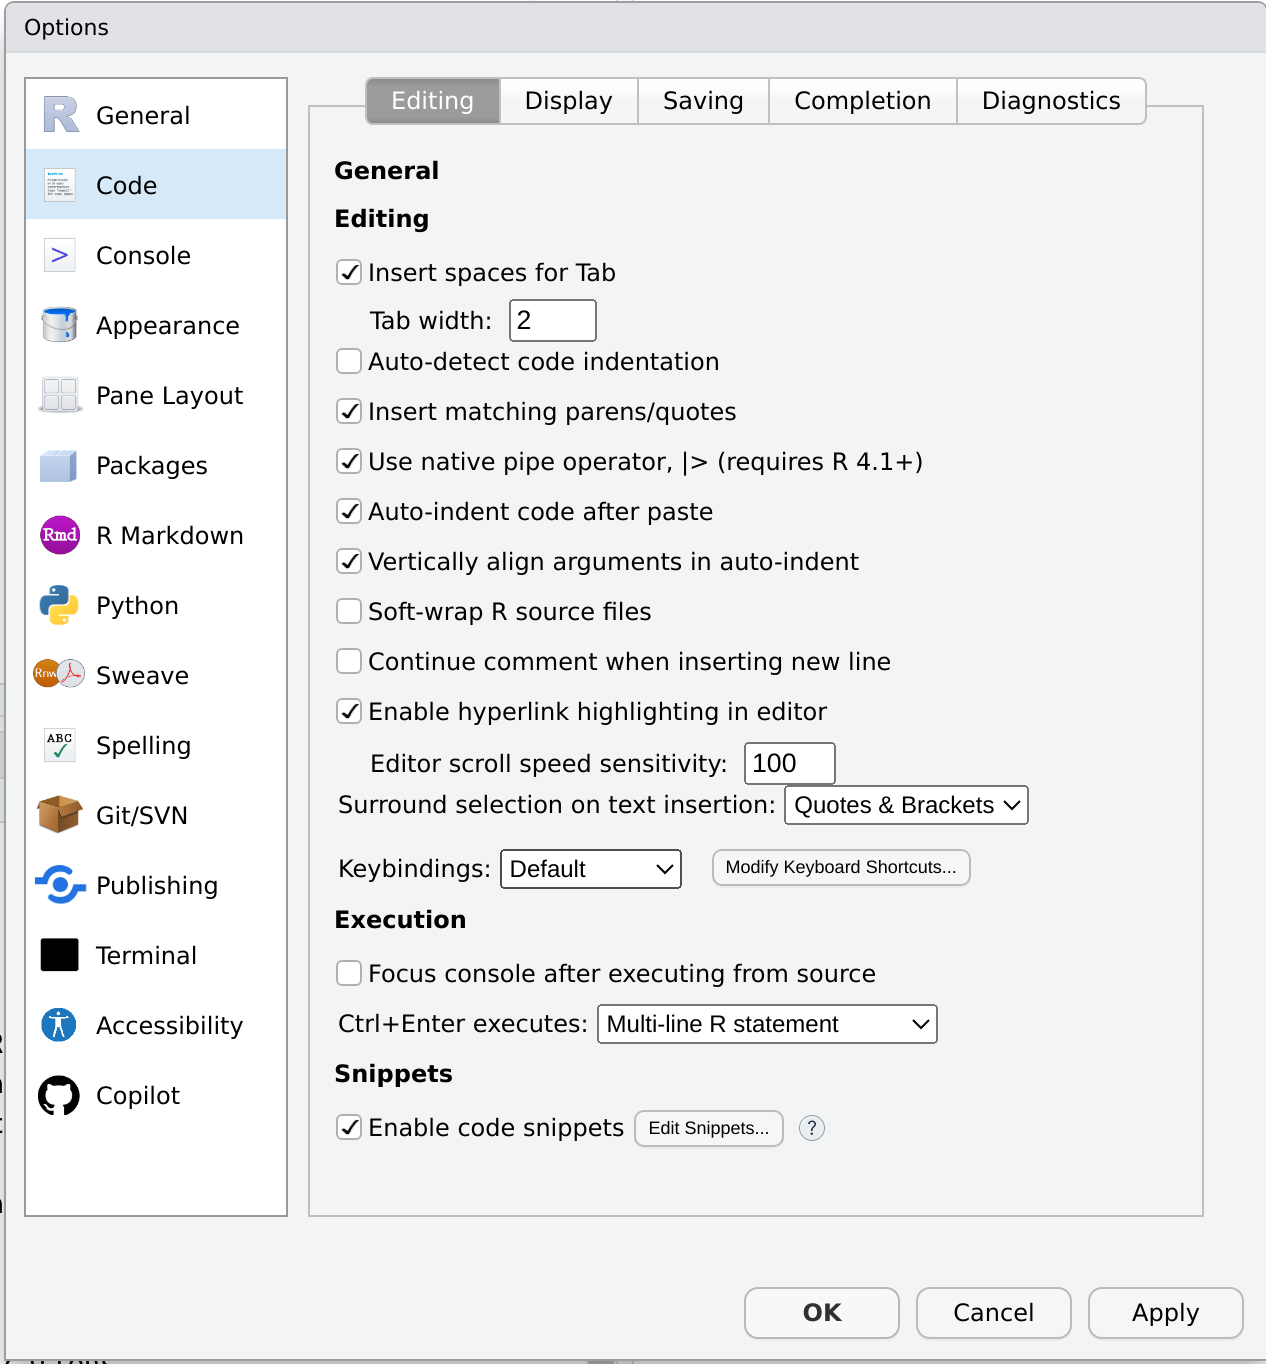
- Code
- “Use native pipe operator
|>” is recommended2 (Optional)
- “Use native pipe operator
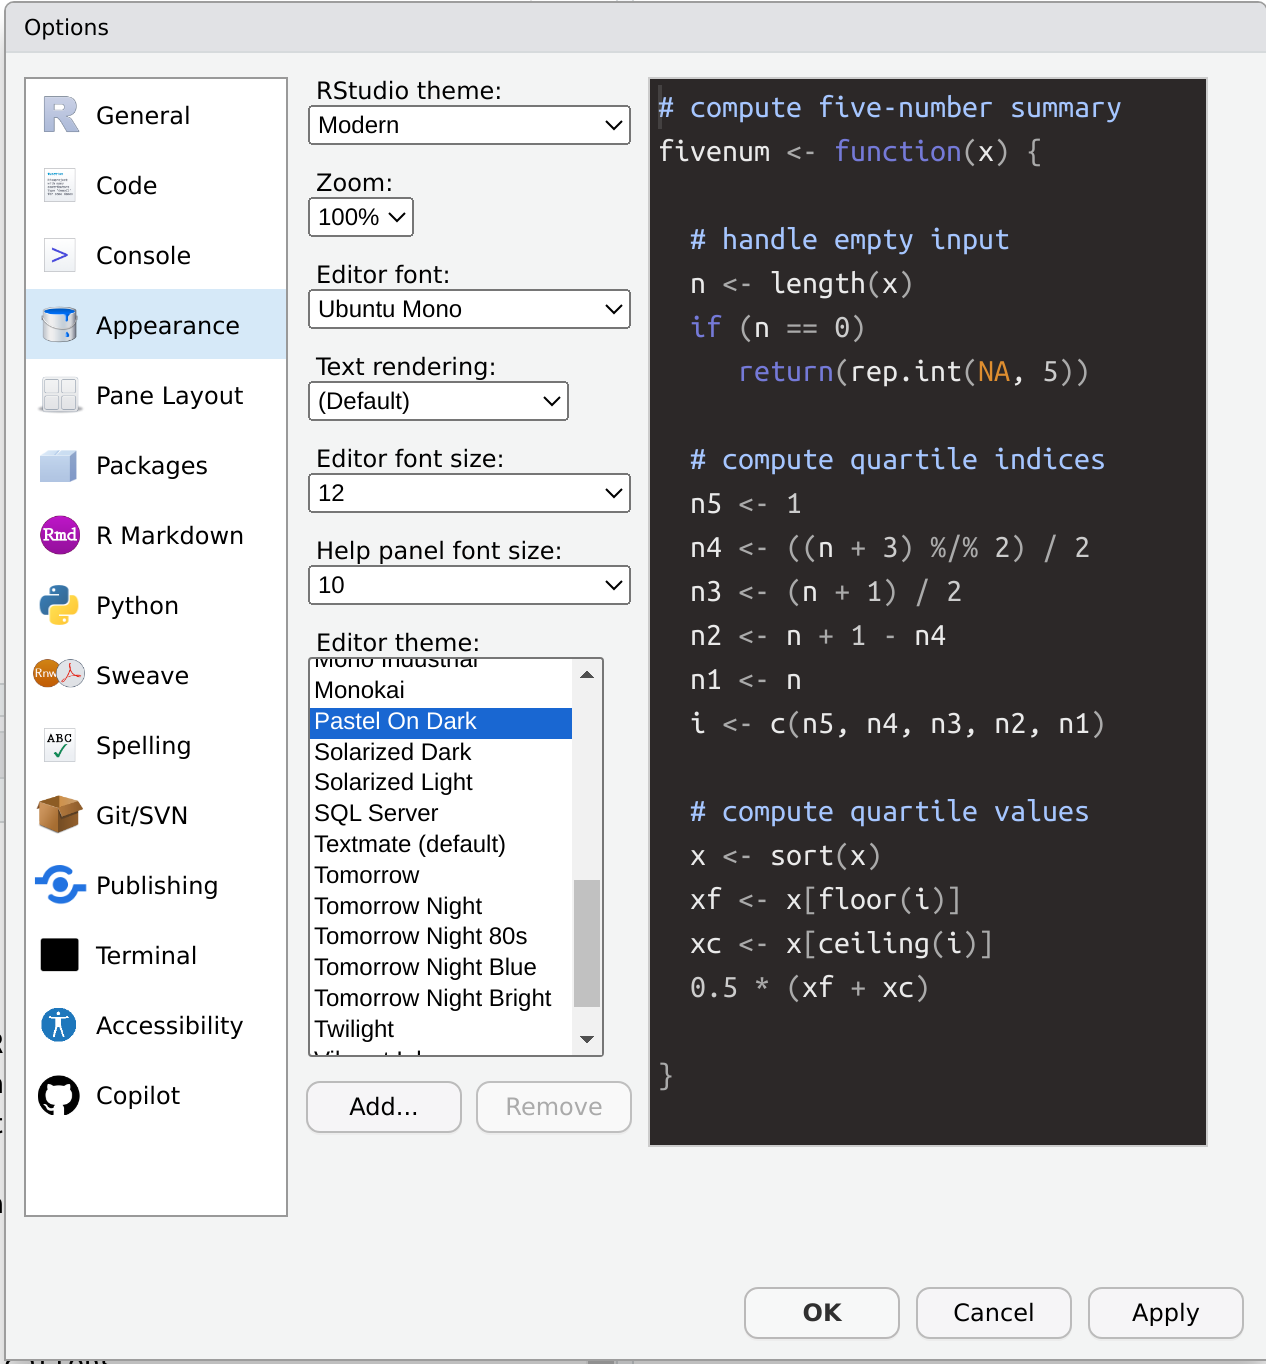
- Appearance
- In the “Editor theme:” box, choose a setting that you will prefer to work in (Optional)
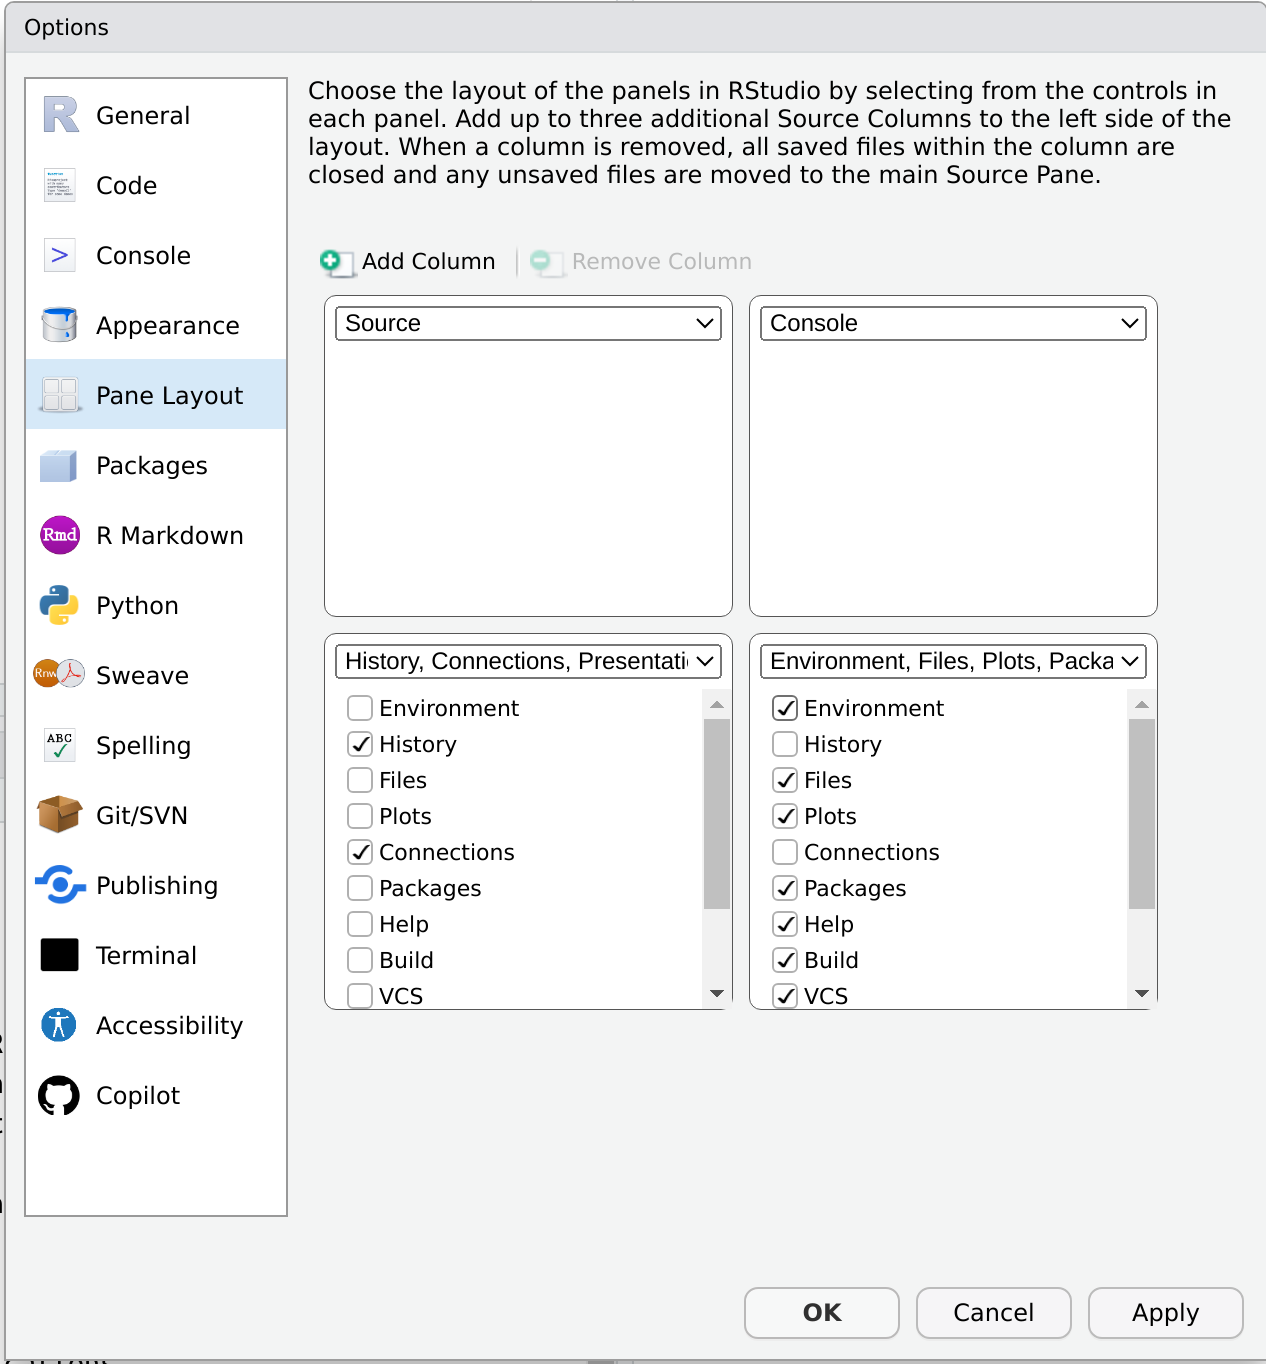
- Pane Layout (Optional)
- Change the pane layout to have the “Console” on the top-right corner
- Add all components (checkmark) to the lower-right corner except for “History” and “Connections”
This will allow for you to expand the “Source” (script) to be expanded for the entire left hand side. It will allow you to view more code at one time.
RStudio will look more like this:
With the expanded script:
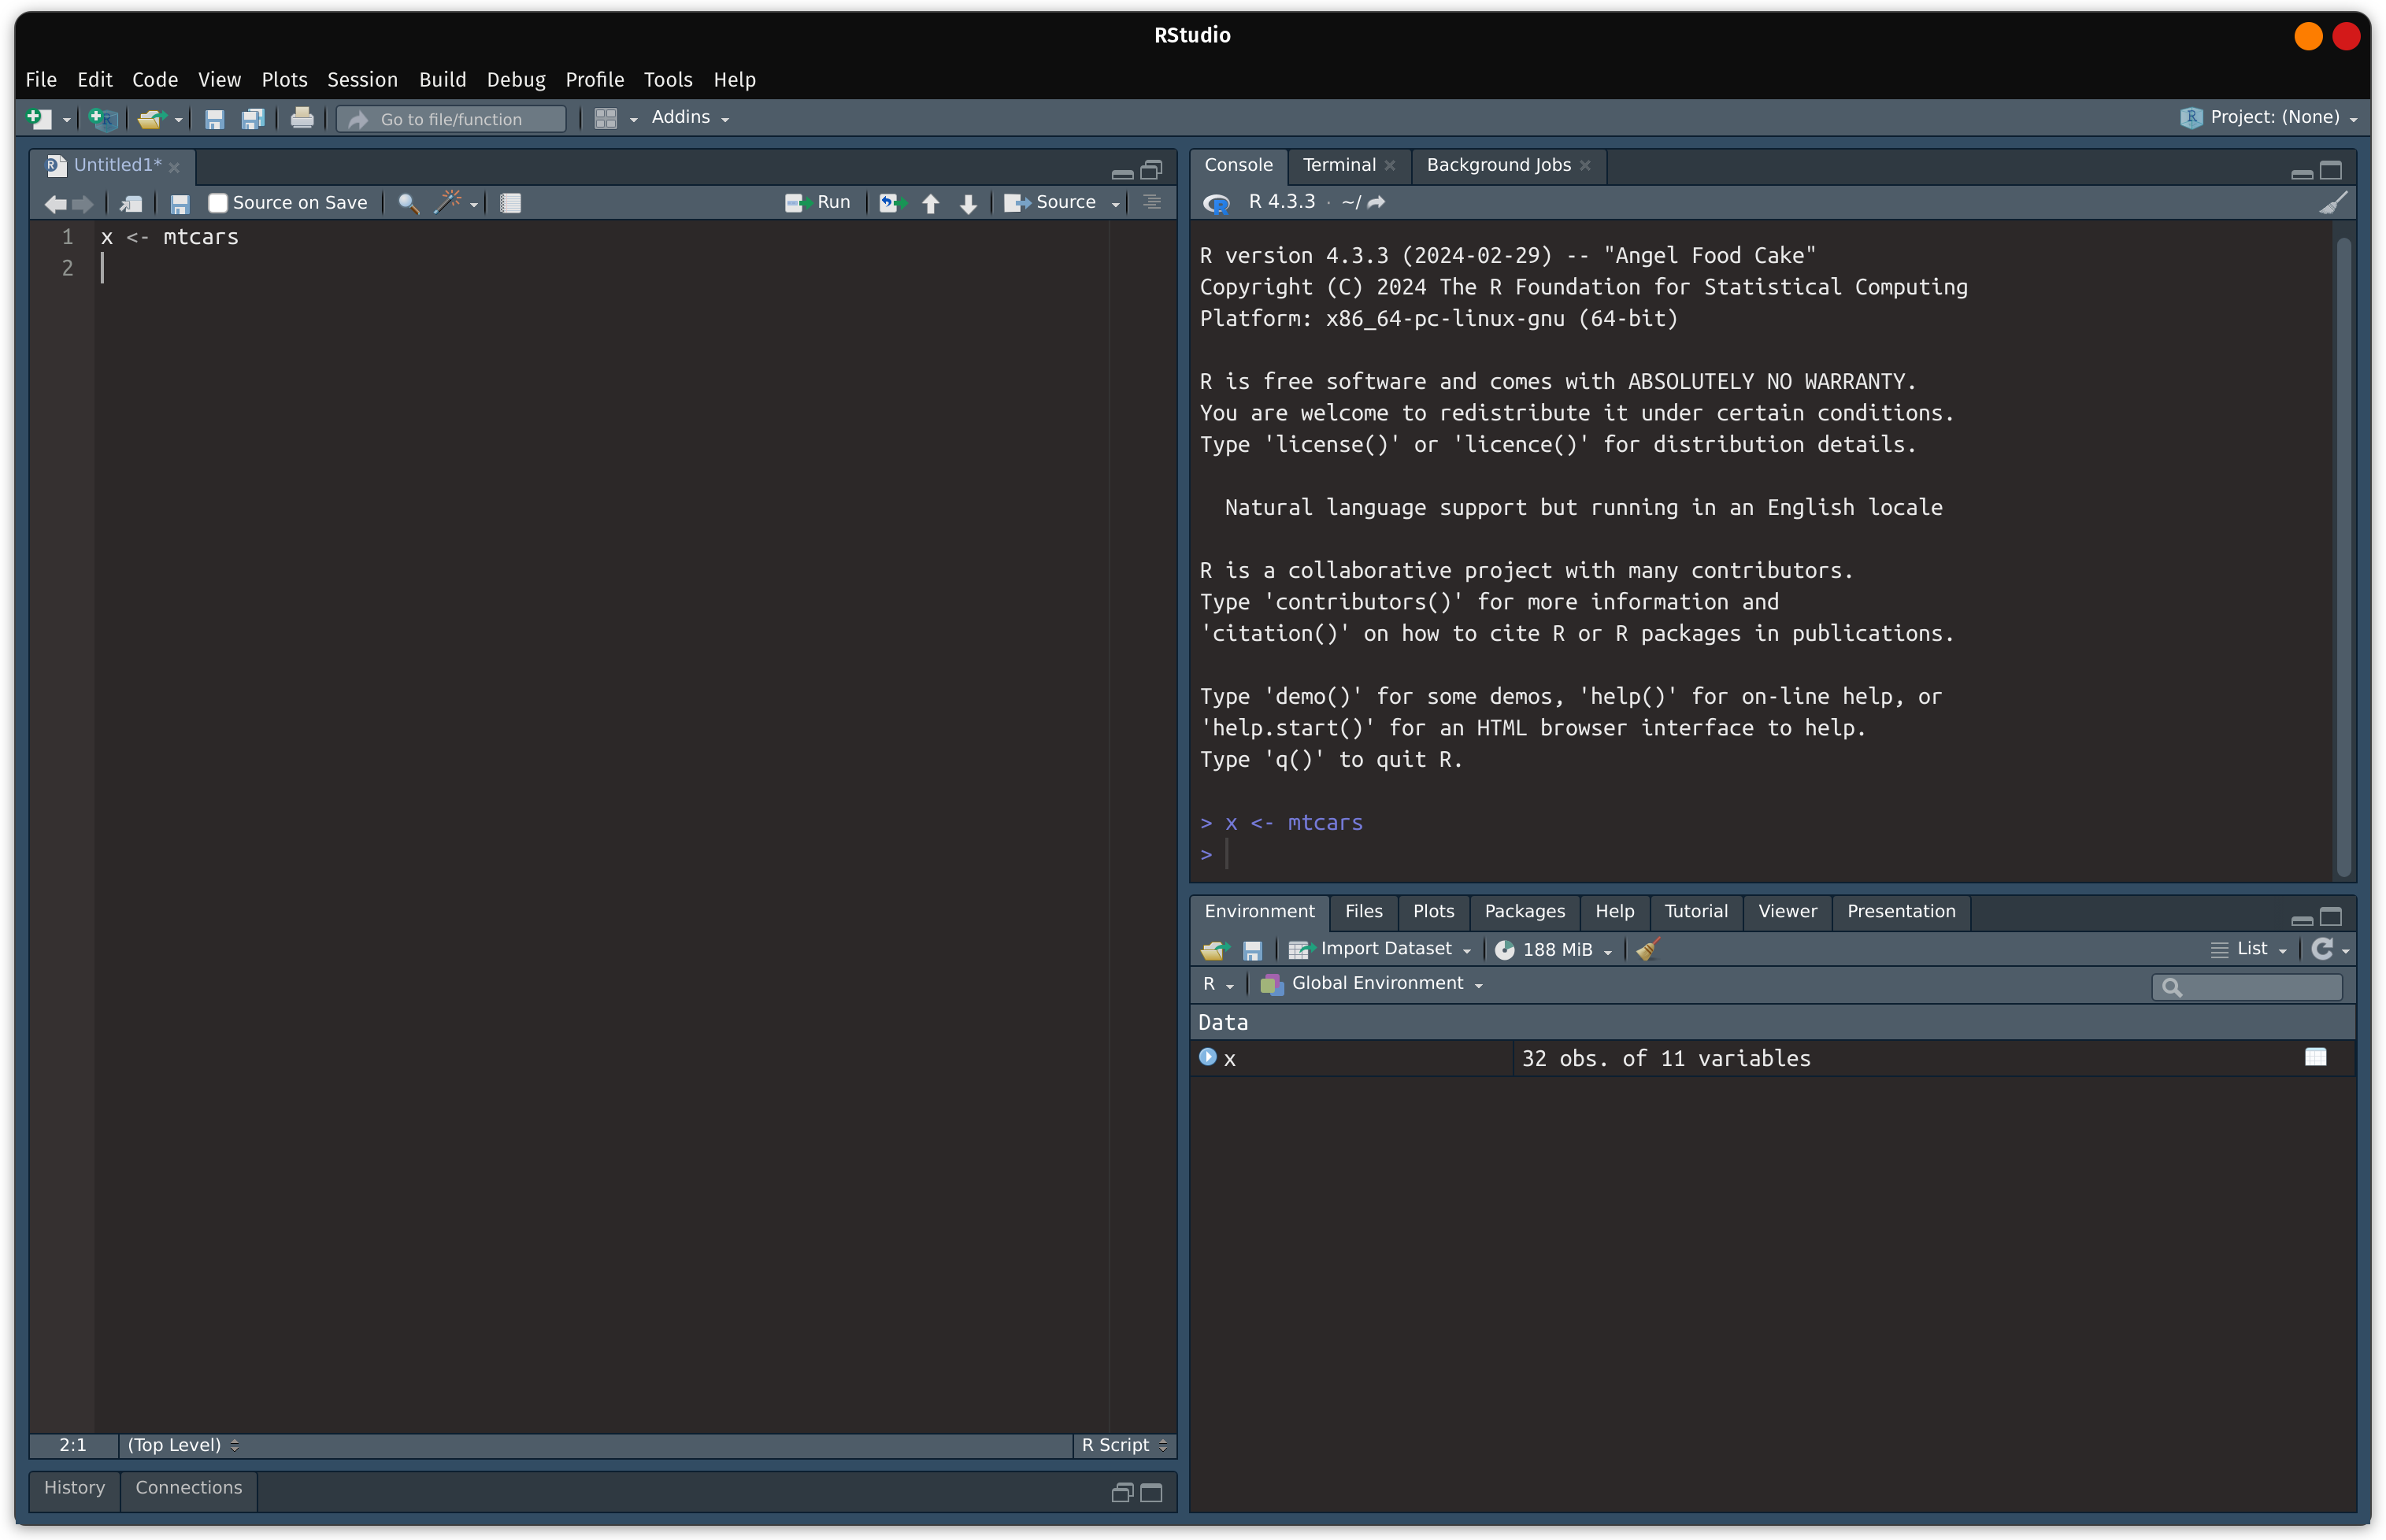
Source, Console and Plots
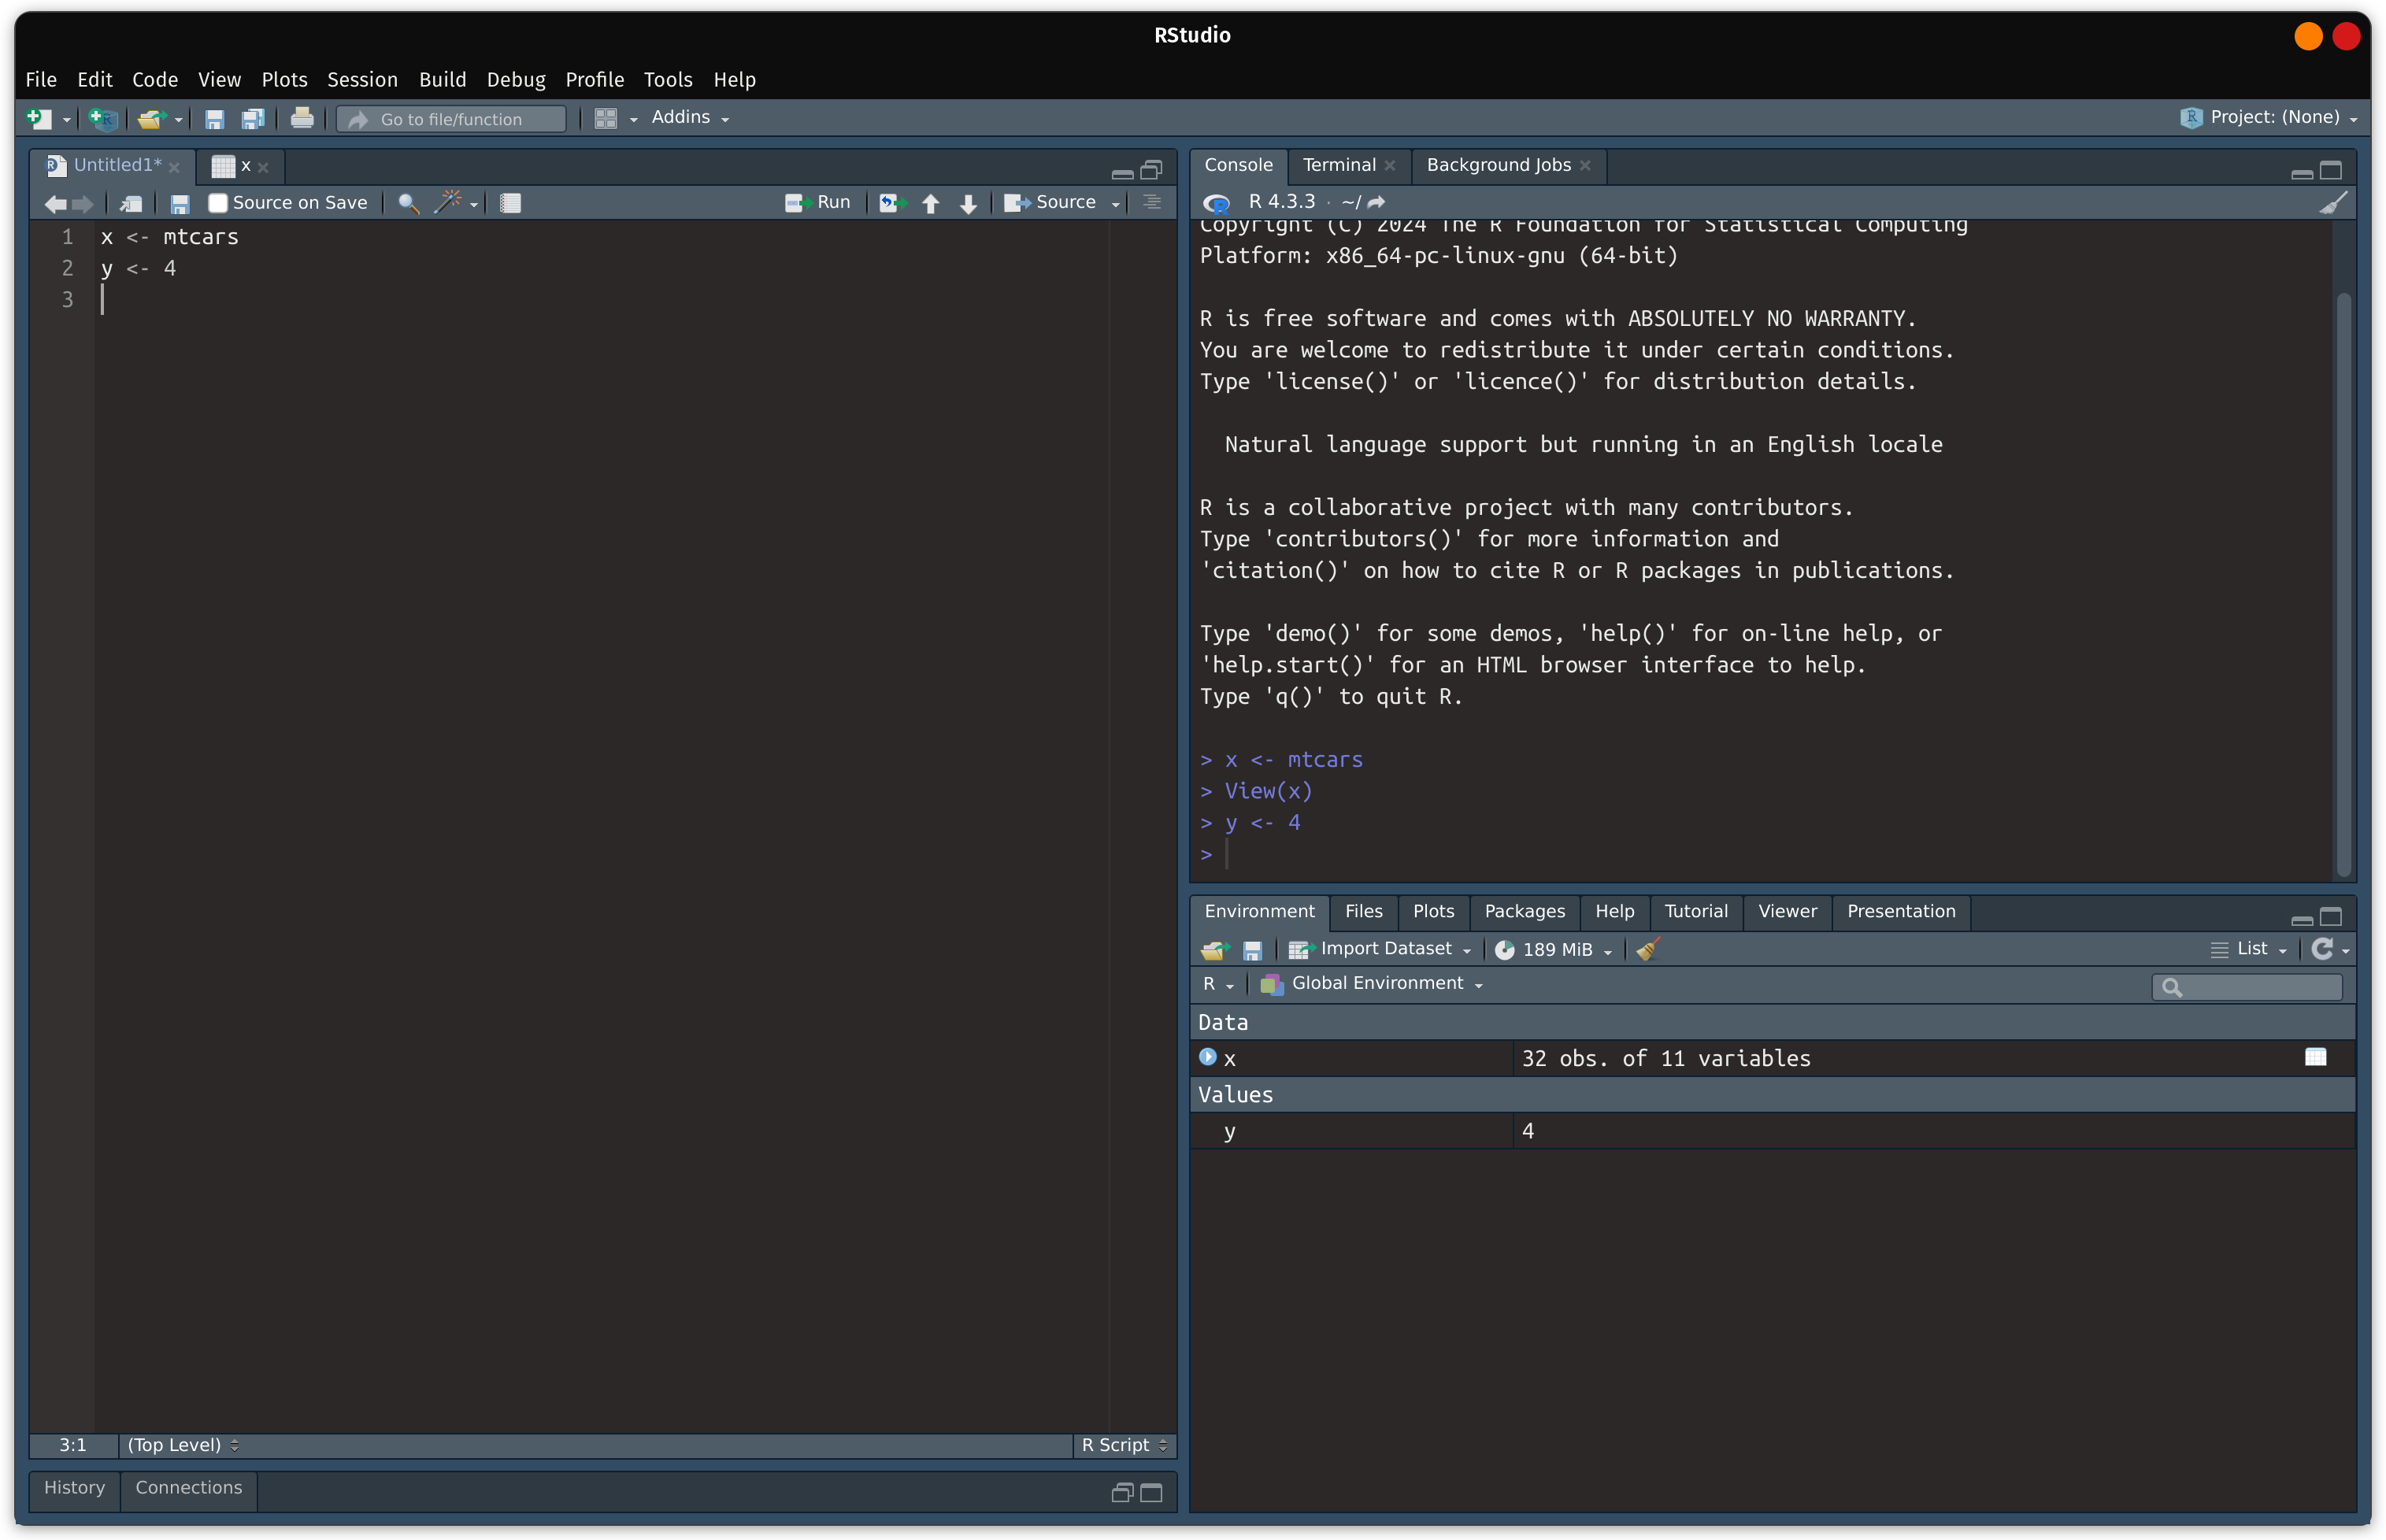
The source pane allows you to write an R script for analysis. Below x <- mtcars is written (top-left) and executed to R (top-right). Afterwards the “Environment” Tab in the lower right pane now how x. The “Environment” tab displays which R objects were created and available to use for further analysis.
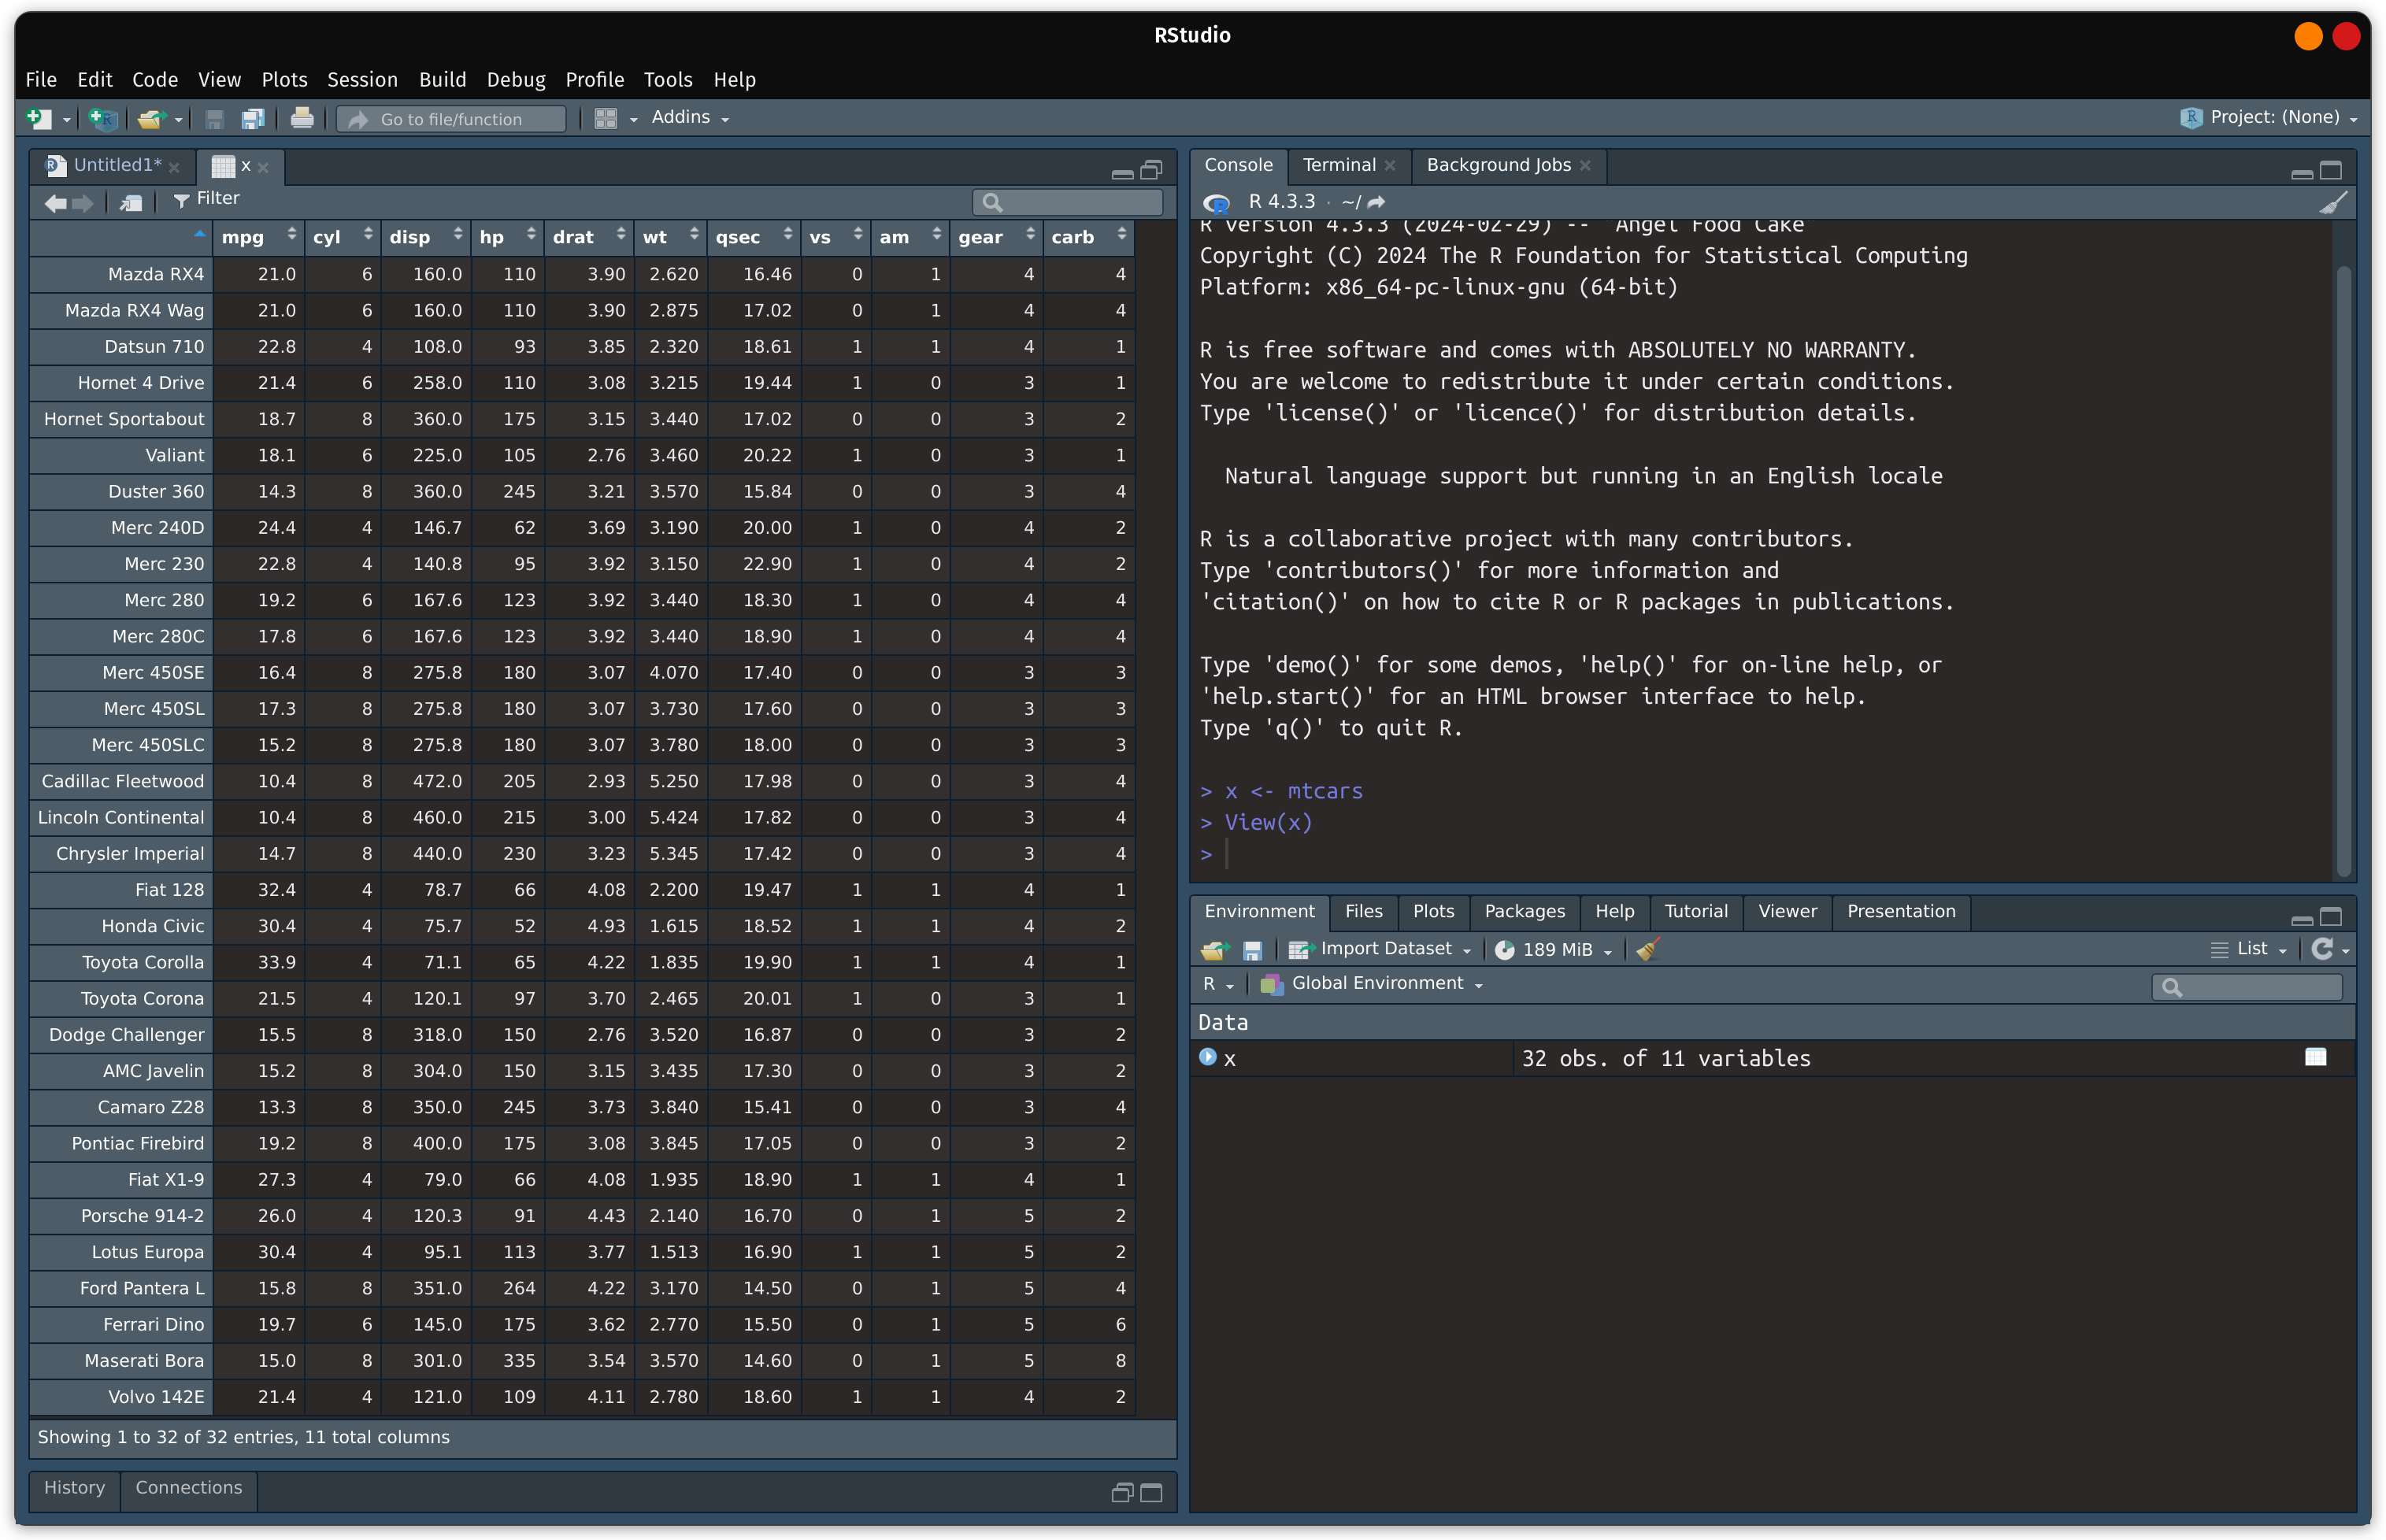
Since x is a data frame, clicking on x from the “Environment” tab will open a new tab in the Source pane containing the data set:
If we create an object that is a vector ( y <- 4 as pictured below), the “Environment” tab now shows a new object as a value.
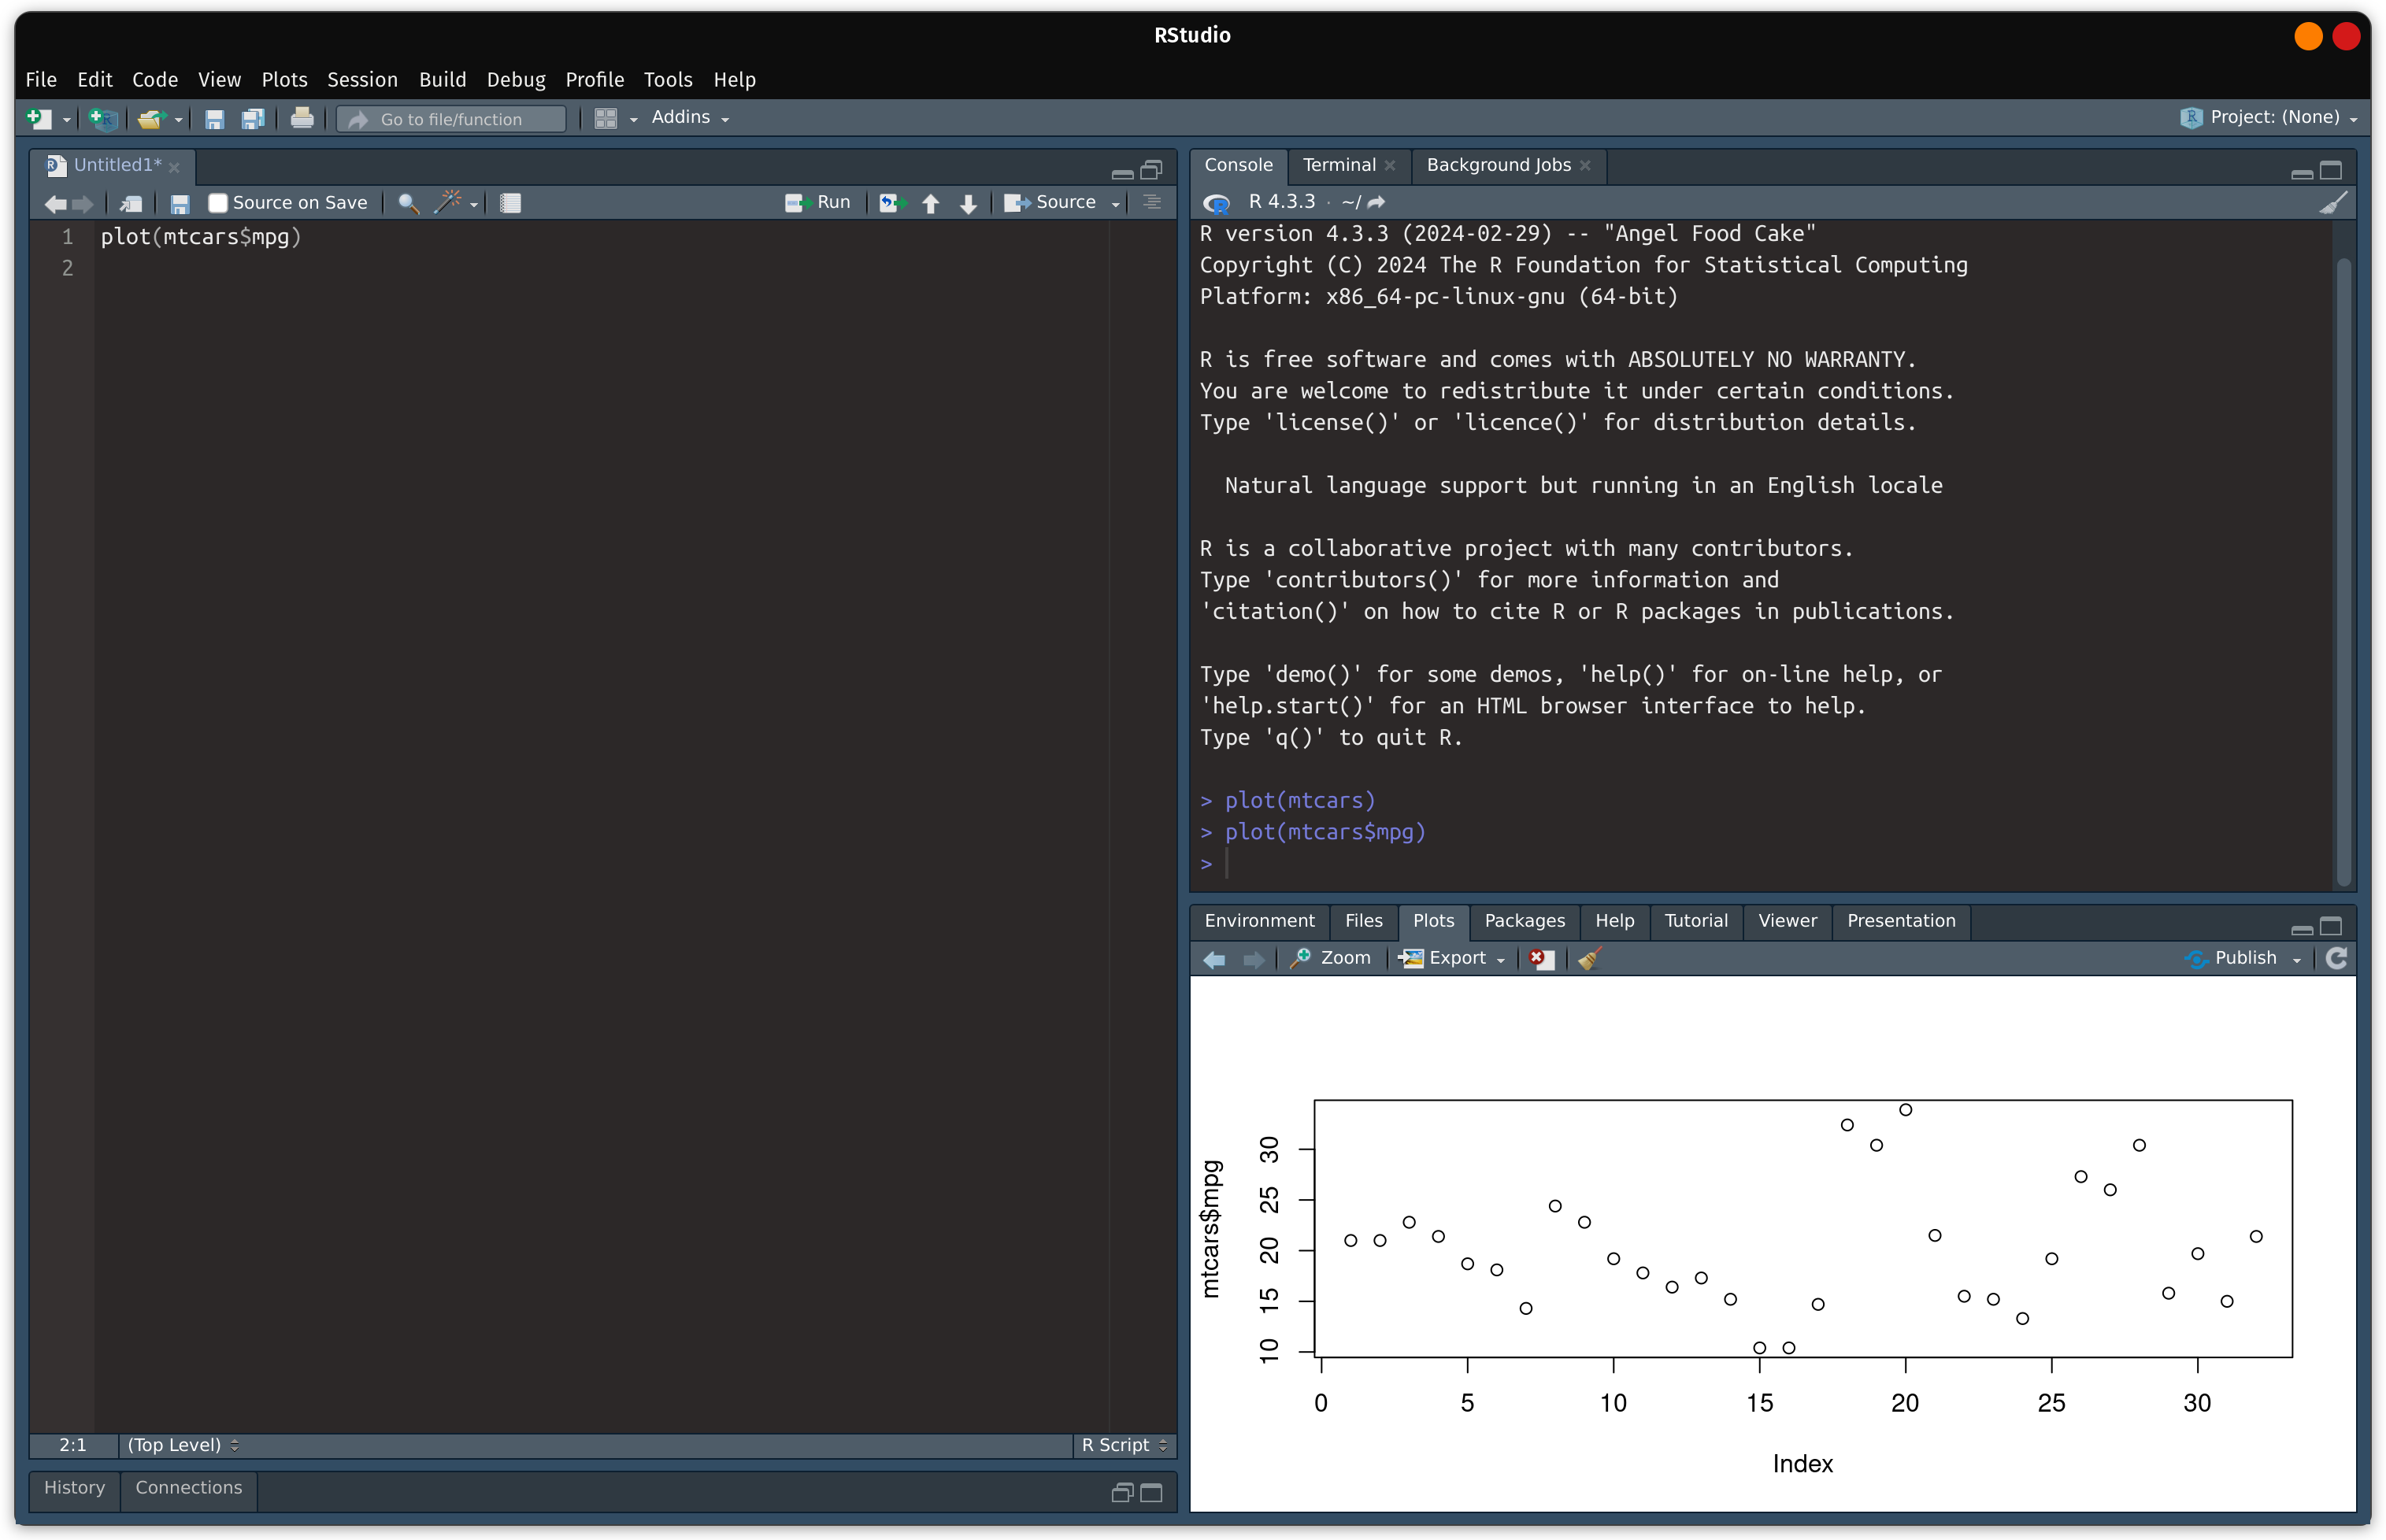
If a plot is created (plot(mtcars$mpg)), a plot will be displayed in the “Plots” tab in the lower-right pane.
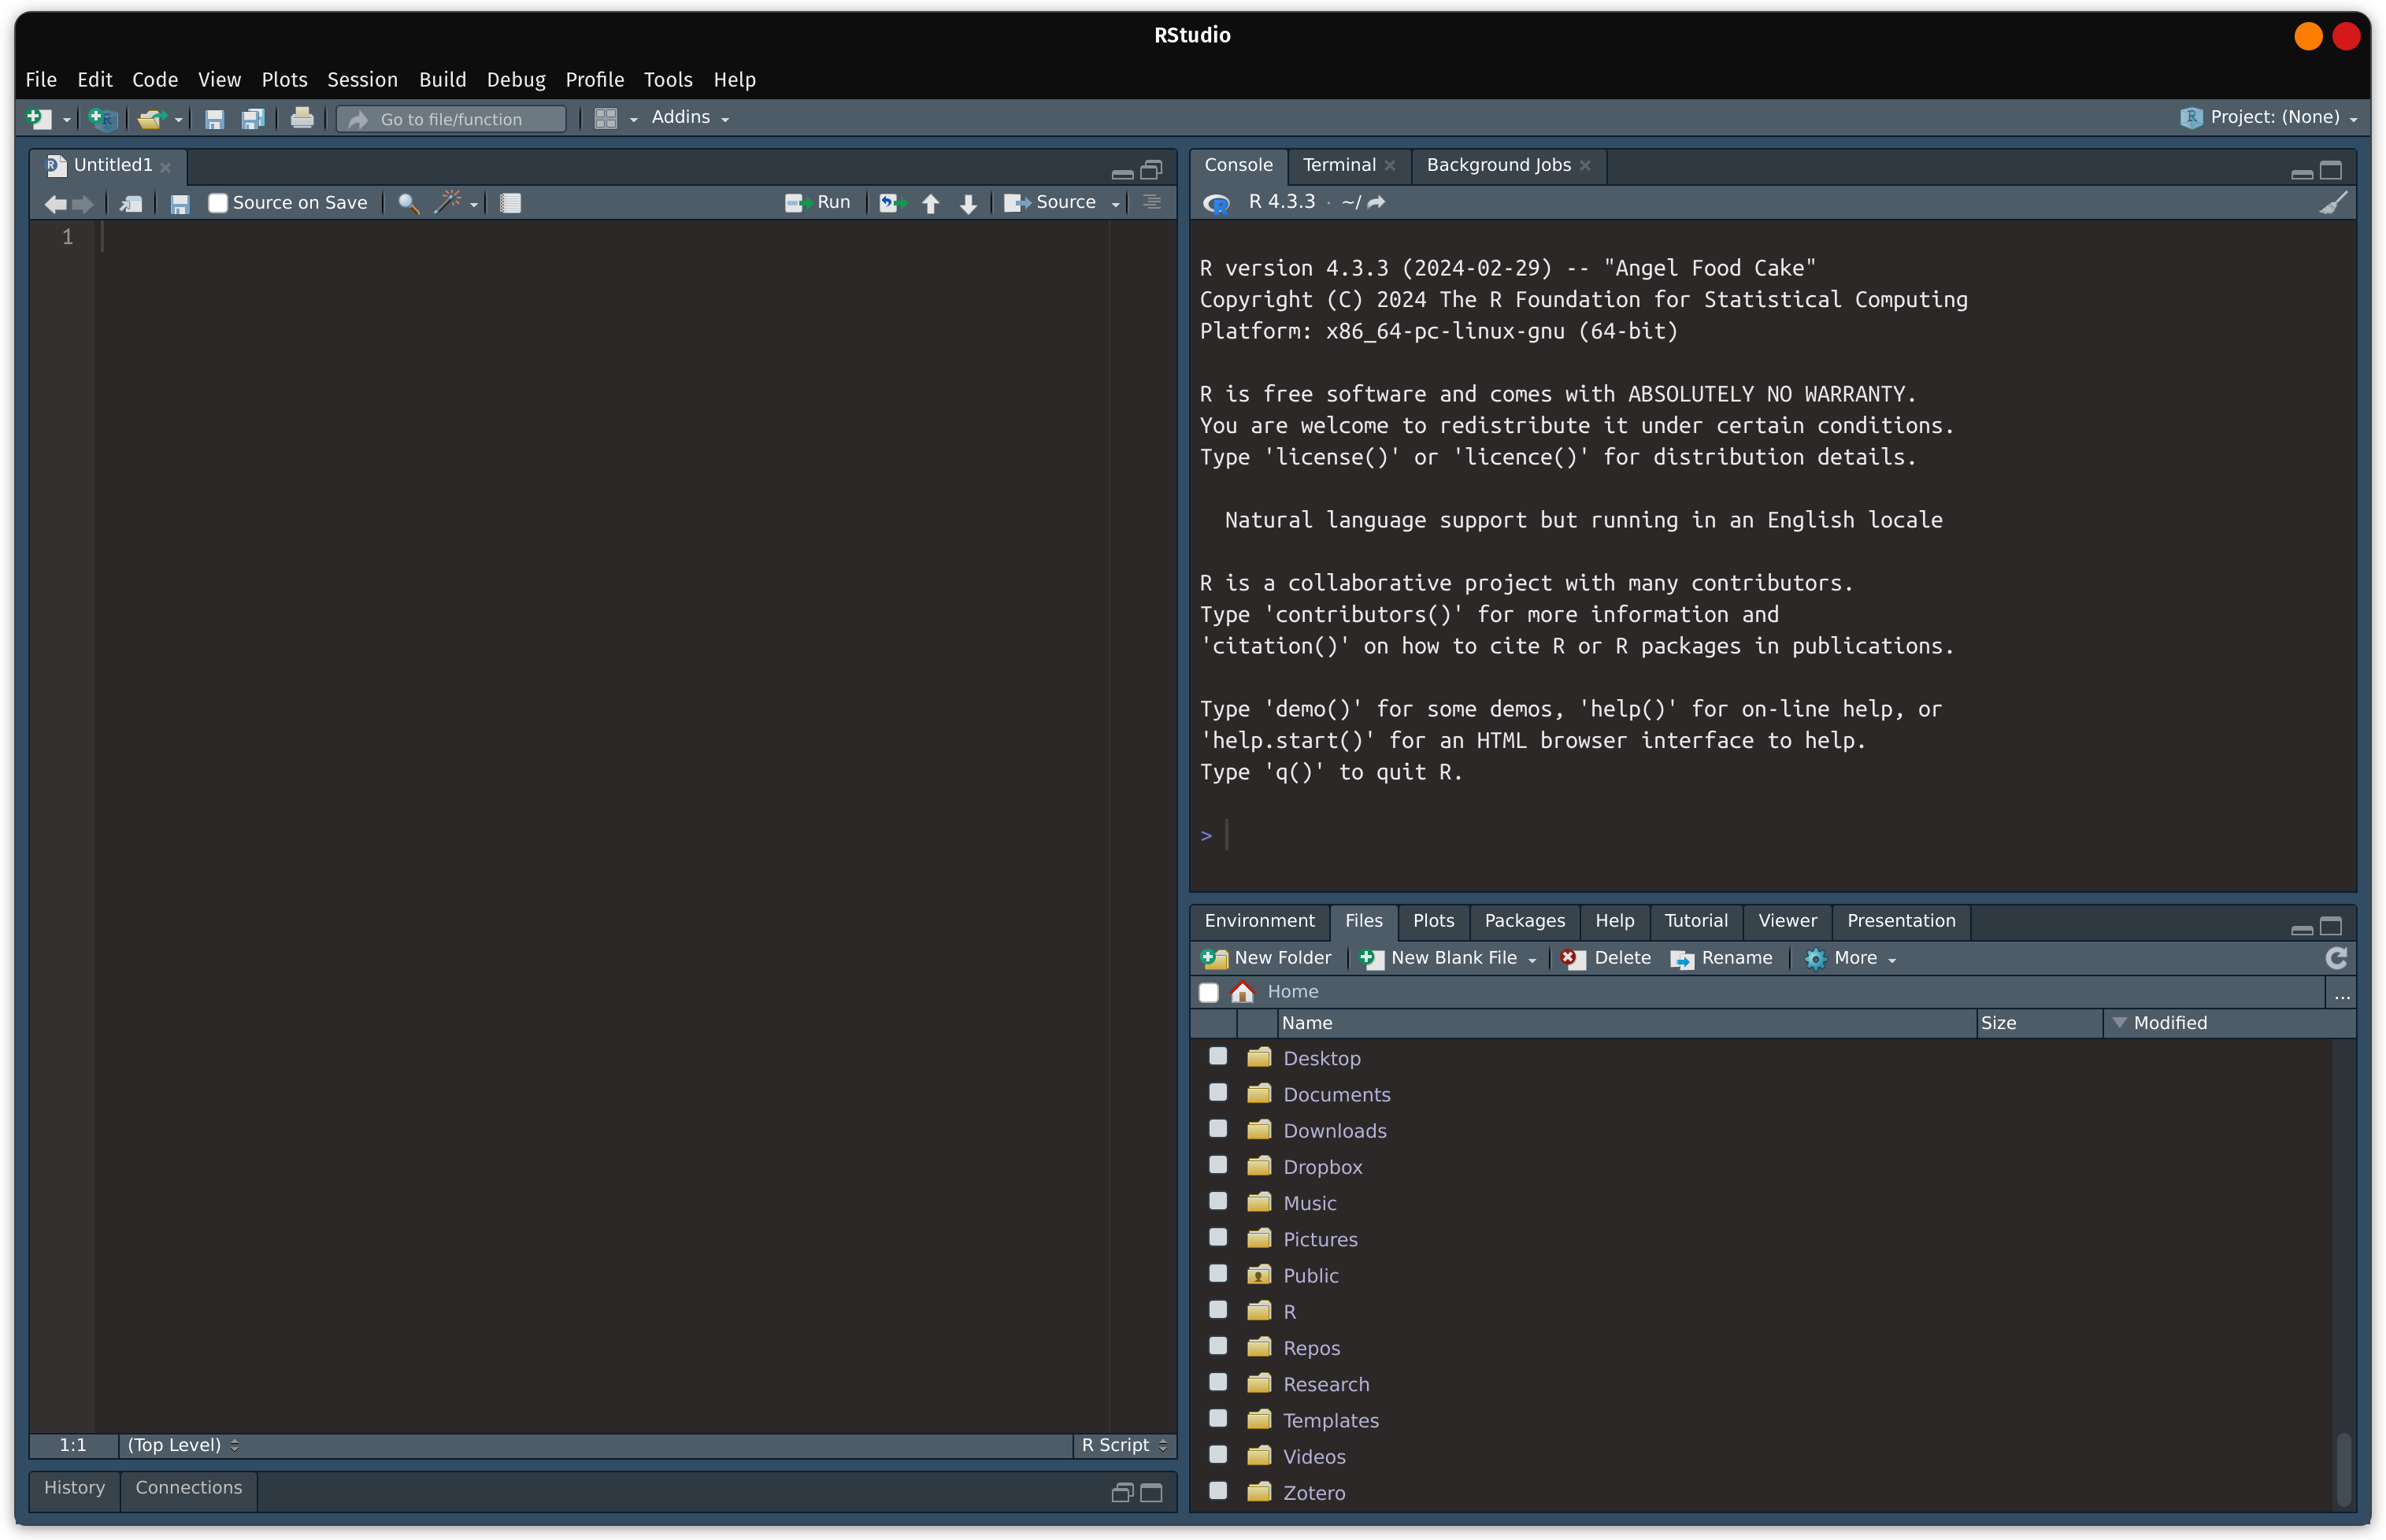
The lower right-pane also contains other useful features such as access to your computer’s file directory:
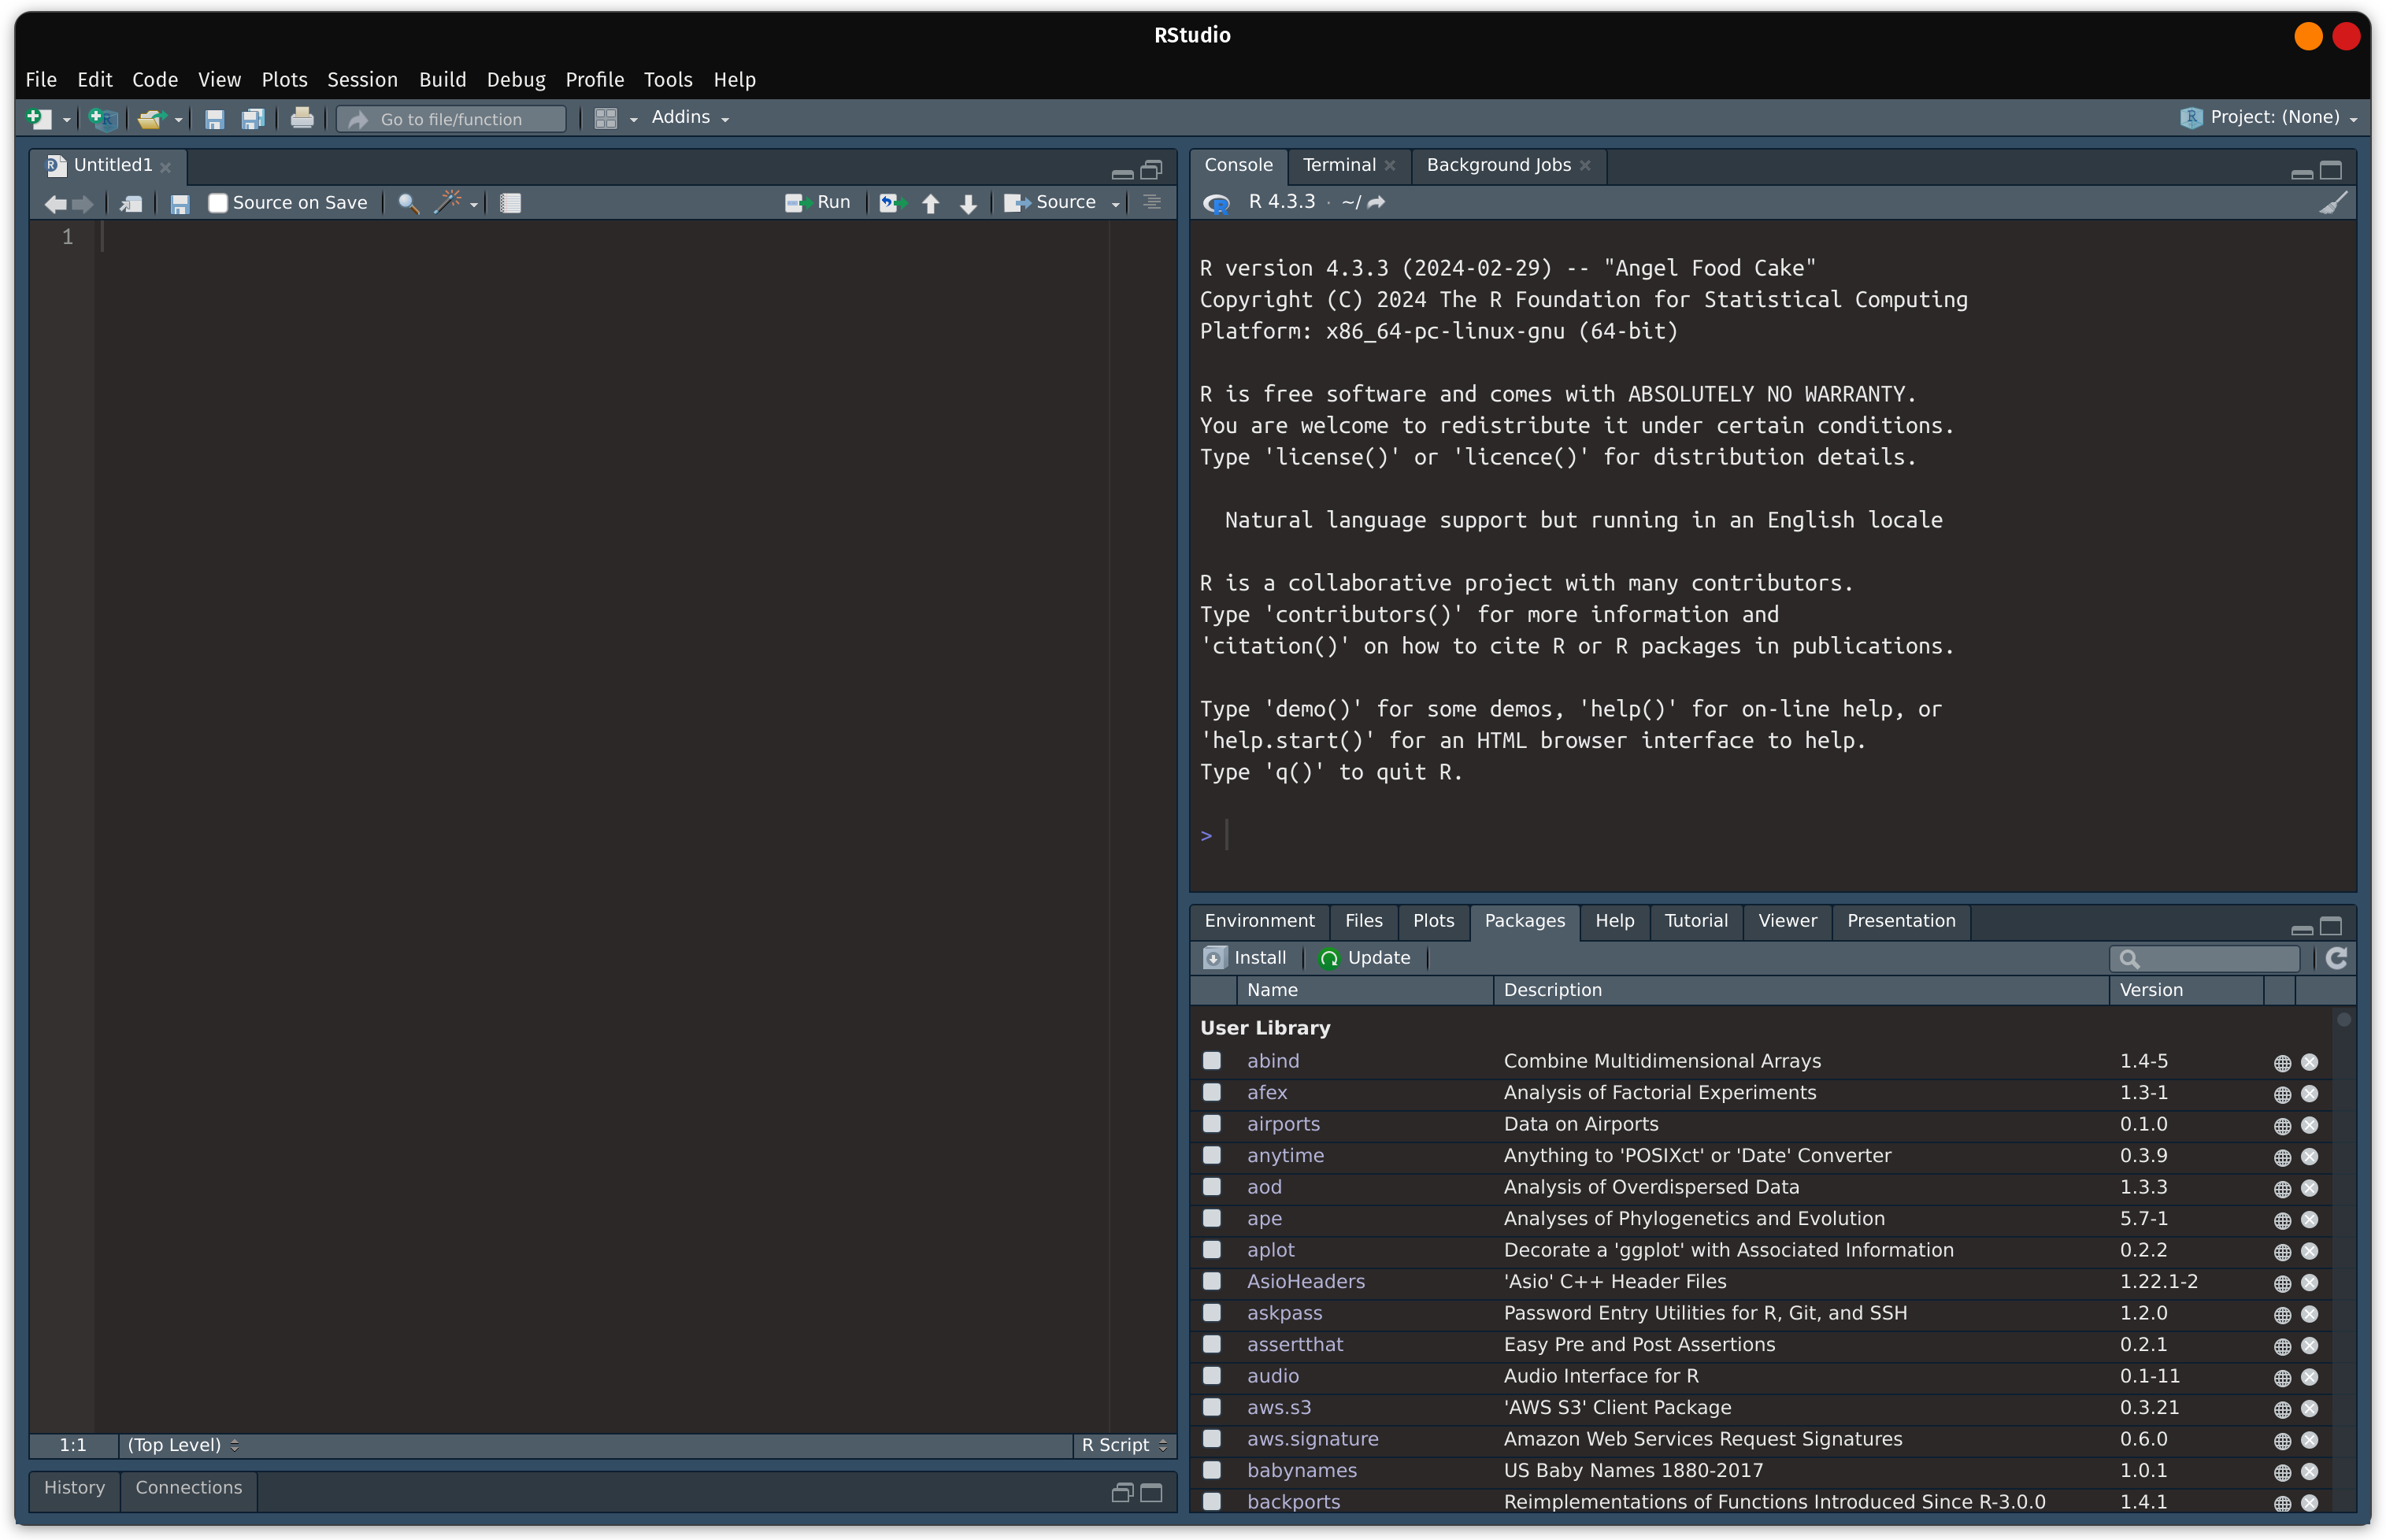
Access to installed packages:
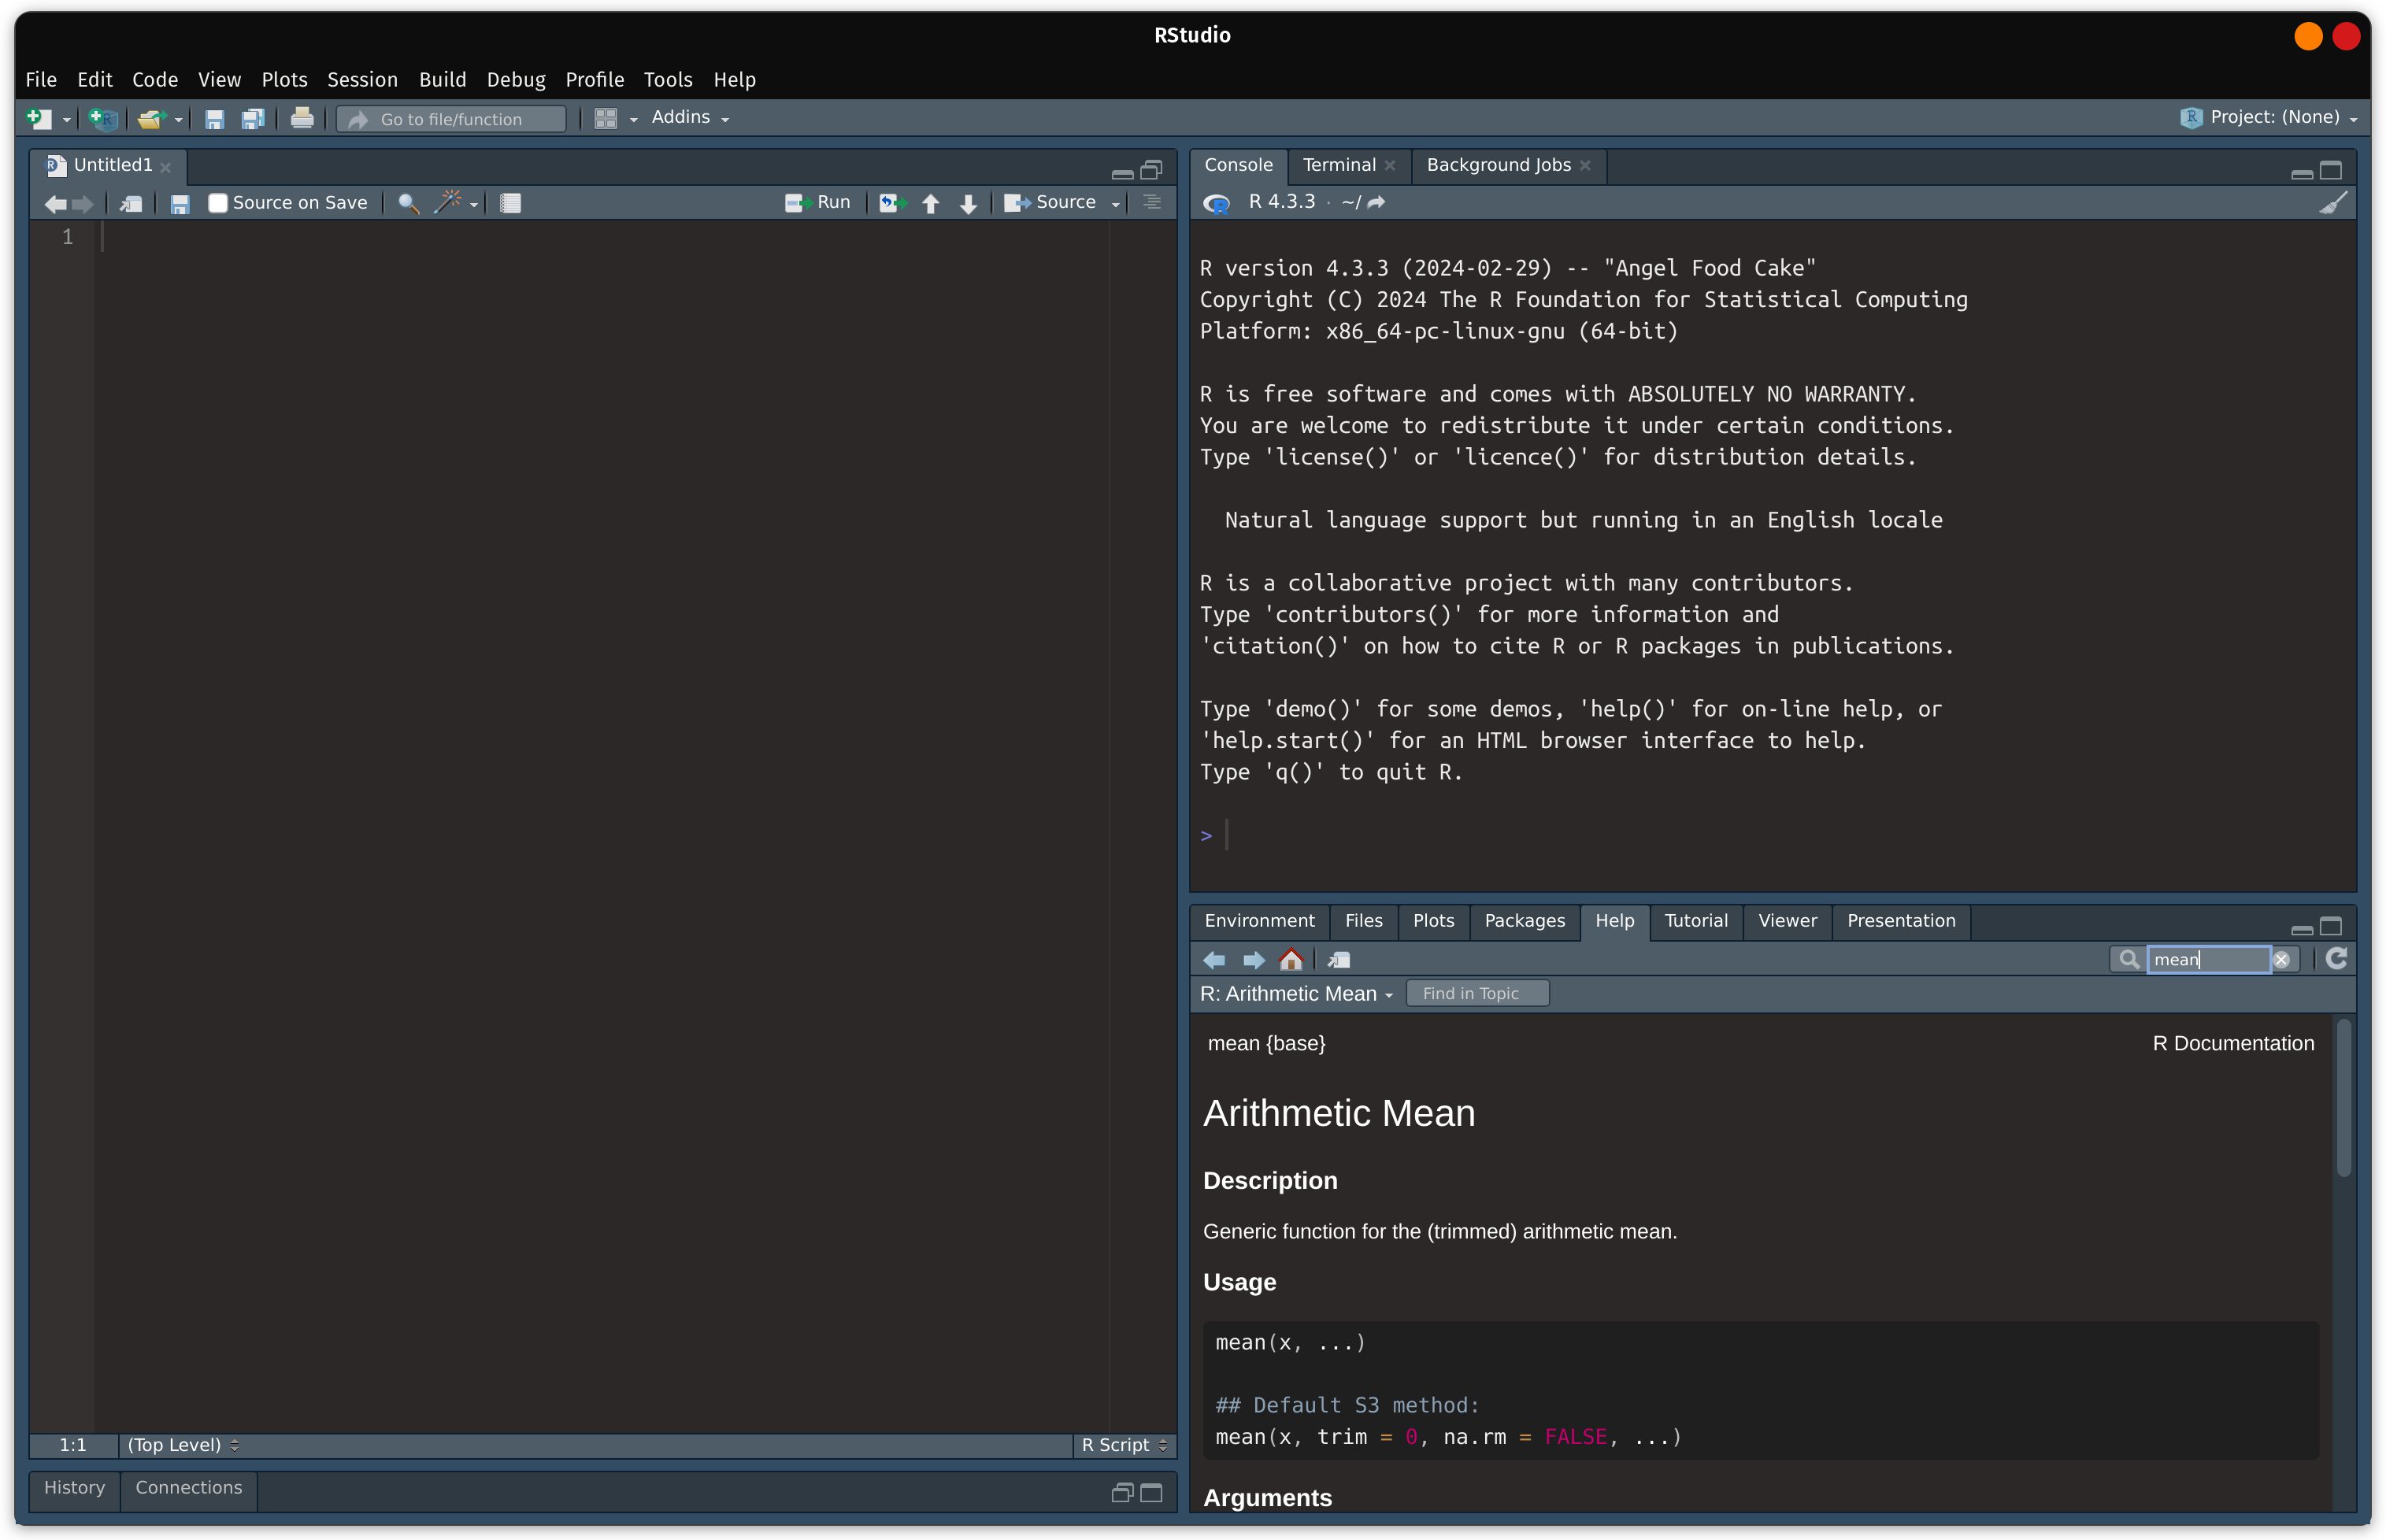
And access to help documentation:
R Packages
R’s functionality can be extended to do more things by installing R packages. An R package can be thought as extra software. This allows you to do more with R. To install an R package, you will need to use the install.packages("NAME_OF_PACKAGE") function. Once you install it, you do not need to install it again. To use an R package, use library("NAME_OF_PACKAGE"). This allows you to load the package in R. You will need to load the package every time you start R. For more information, please watch the video:
install Packages from RStudio, Inc. on Vimeo.